A digital twin to design, analyse, and visualise low-traffic neighbourhoods
AI:UK Research in action
The problem
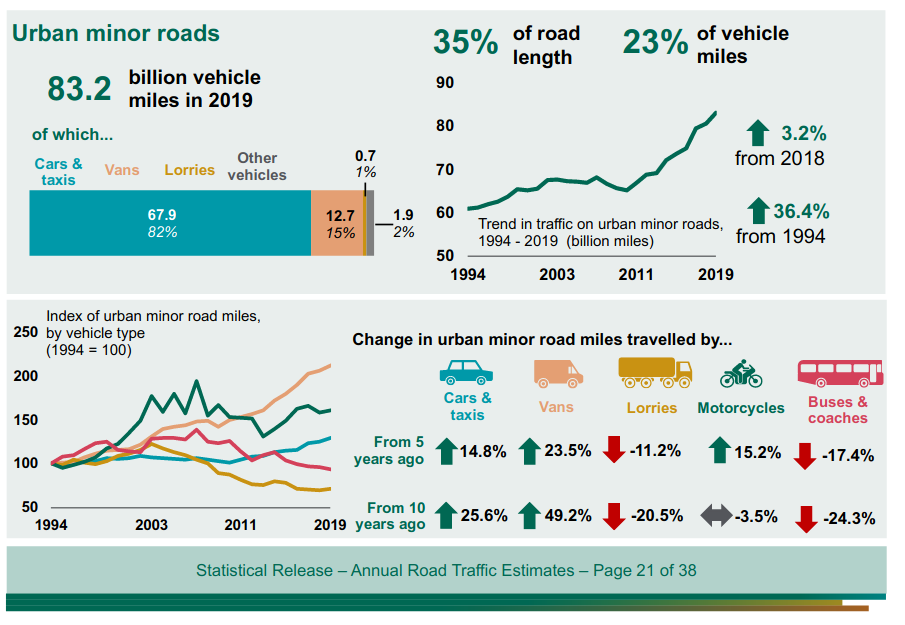
Rise of traffic on local streets from sat-nav
The response
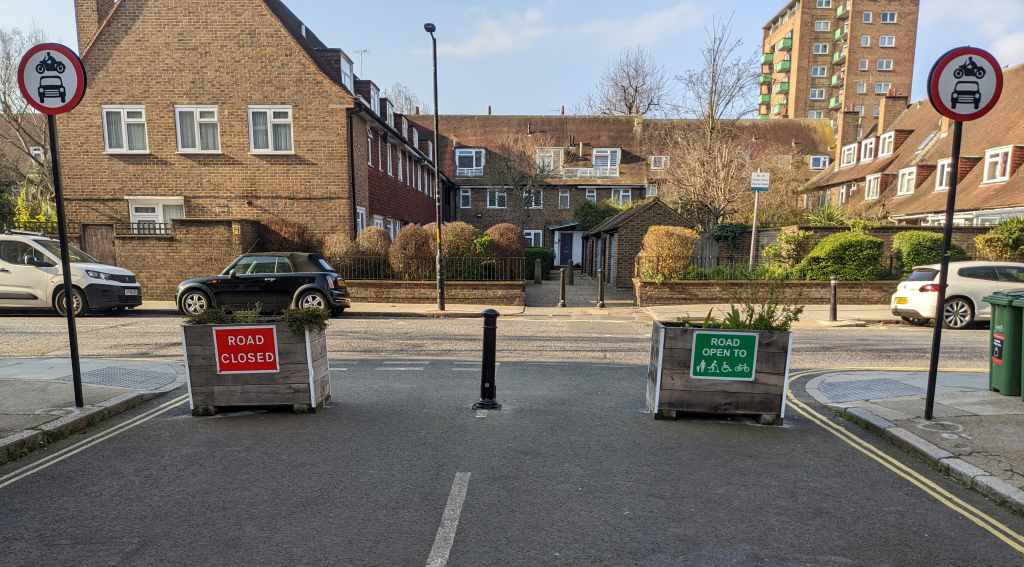
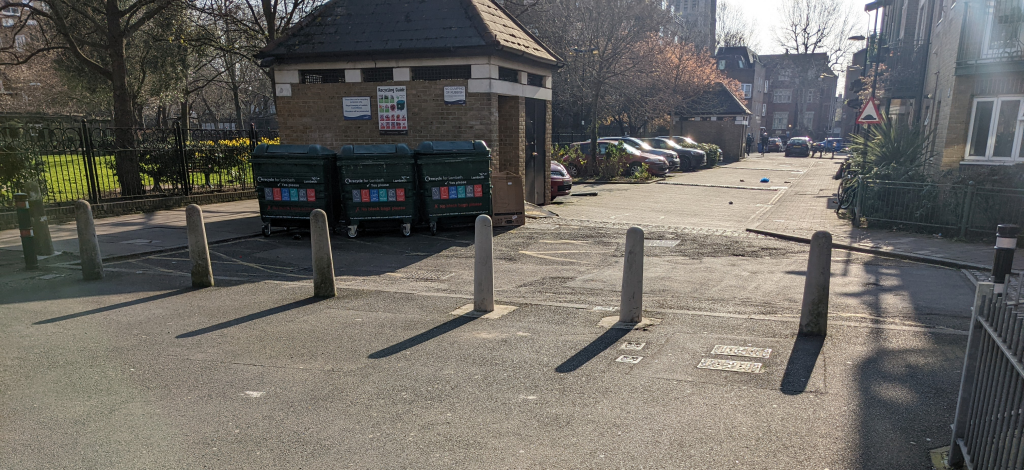
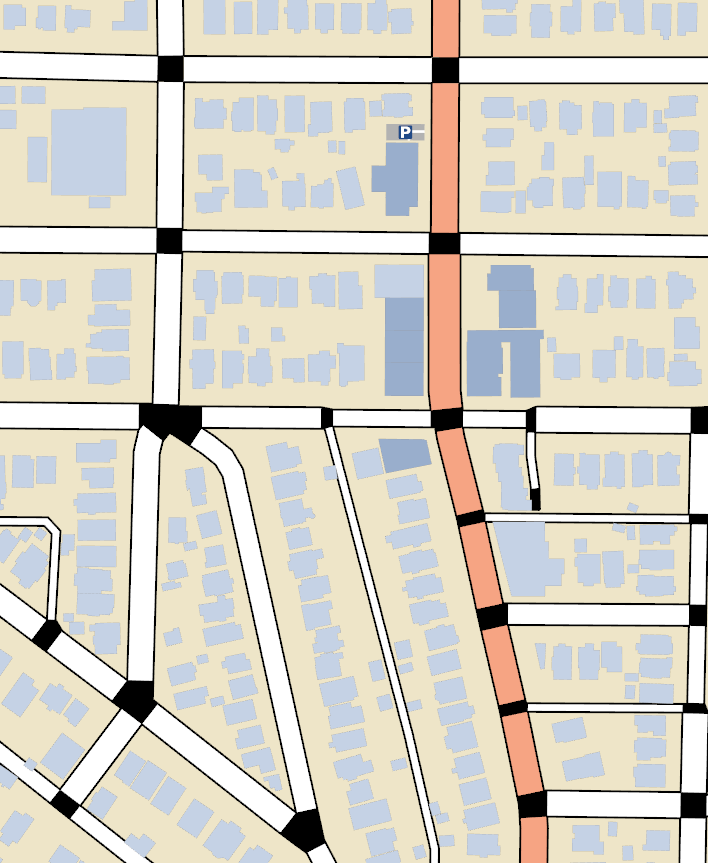
Modal filters
The response
Area of effect = Low traffic neighborhoods (LTNs)
The current planning process
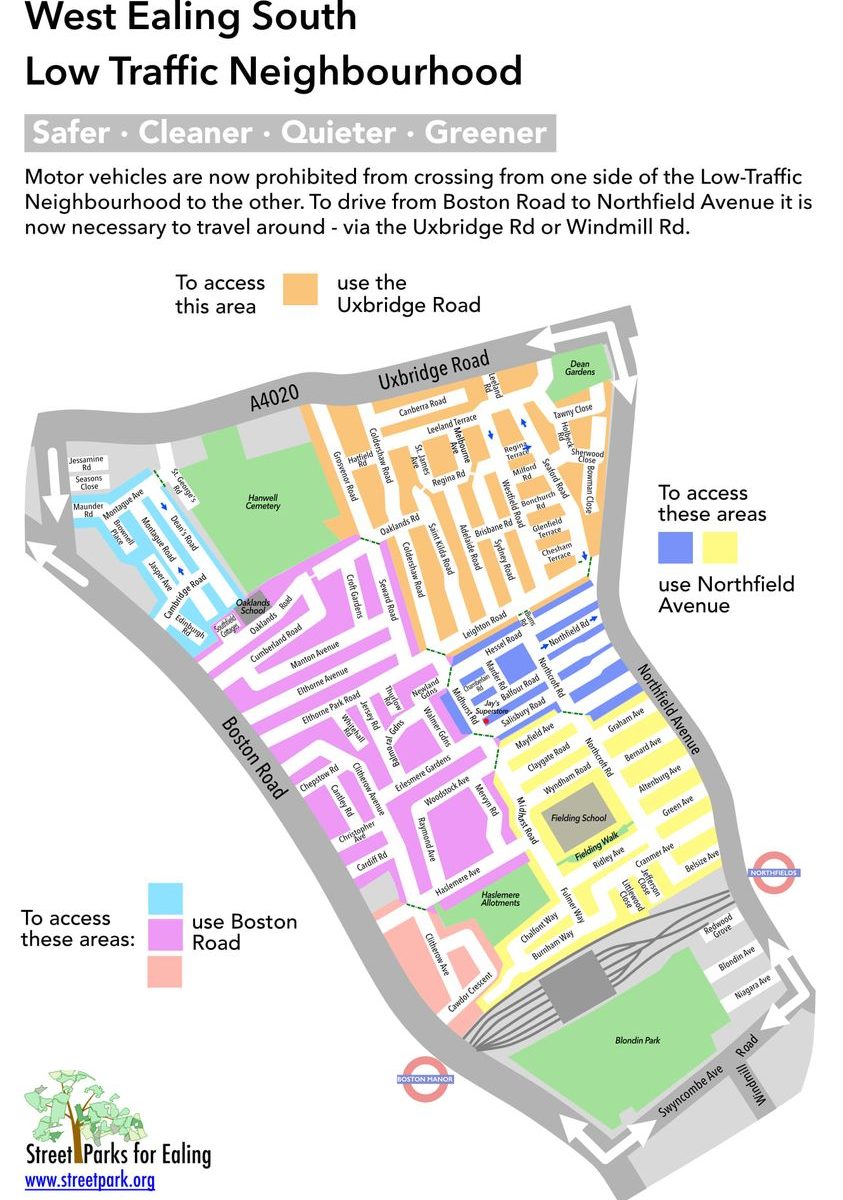
Communication by diagram
The current planning process
- Live workshops
- https://www.youtube.com/watch?v=pHucS2F33W8&t=1052s
The current planning process
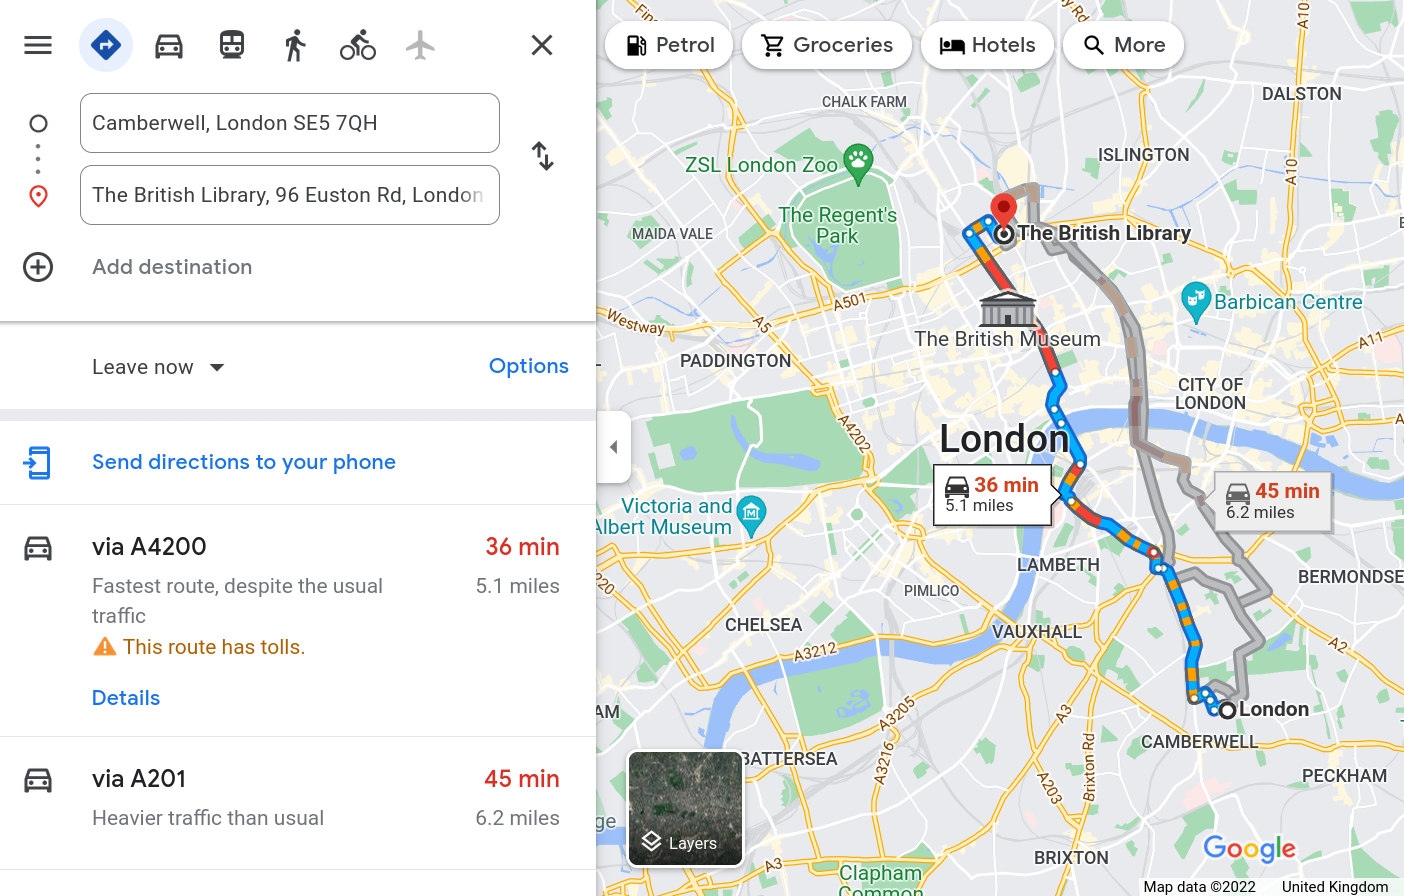
- How’s this affect my trips?
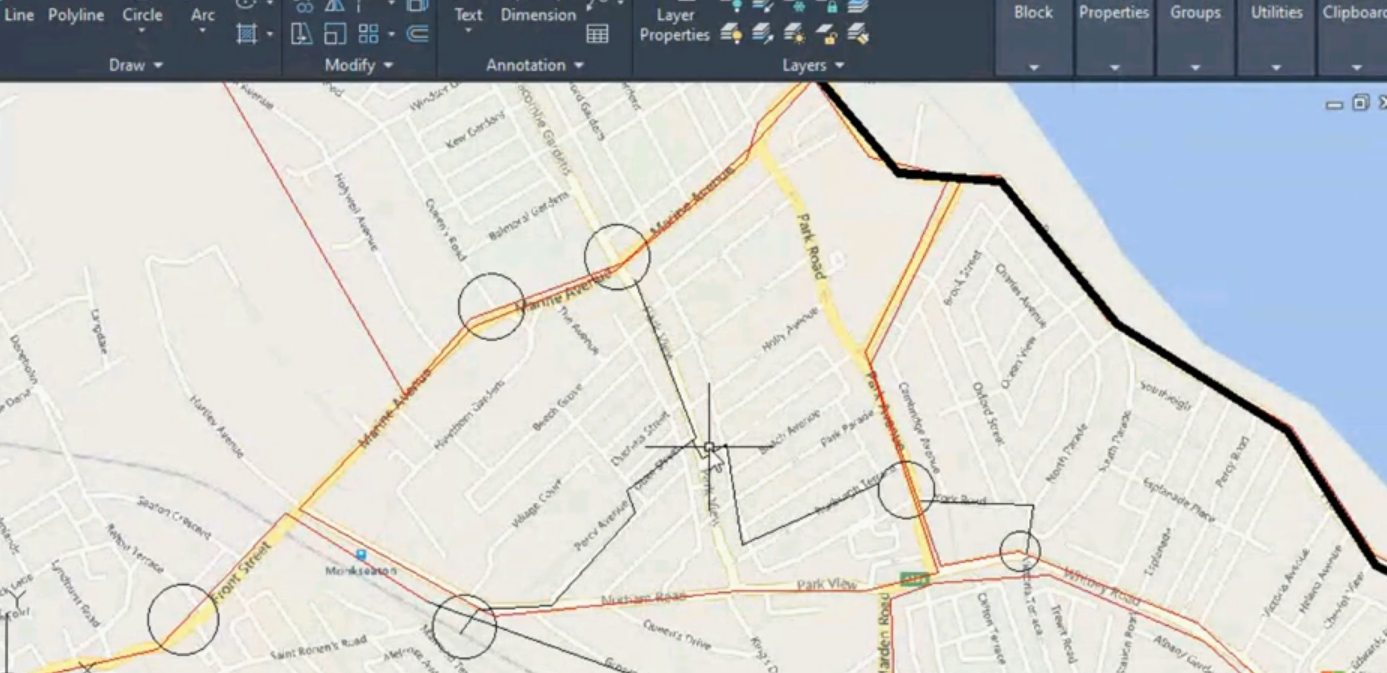
Architecture

OpenStreetMap into a graph
- Edges: road segments
- Nodes: junctions
- one-way streets, lane configuration
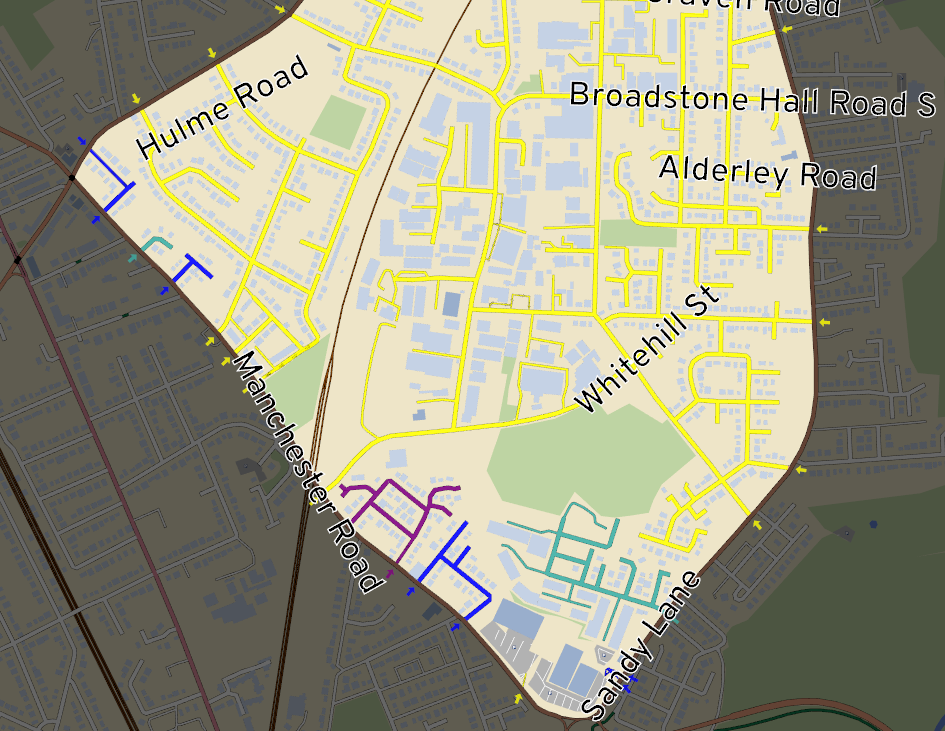
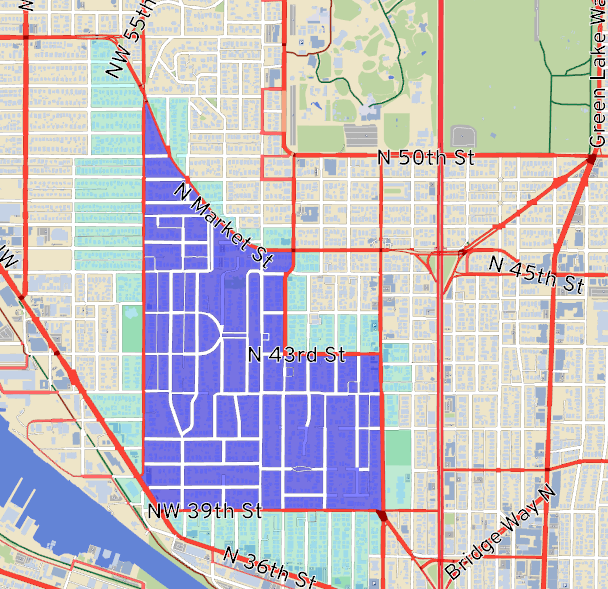
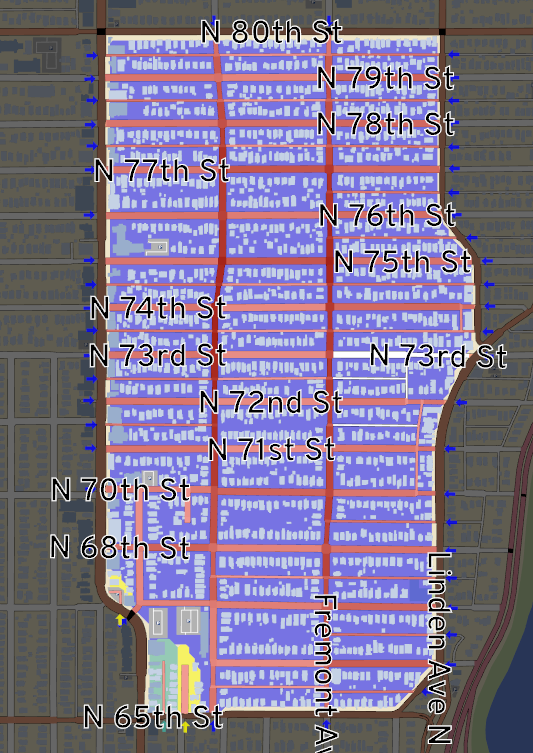
A neighborhood
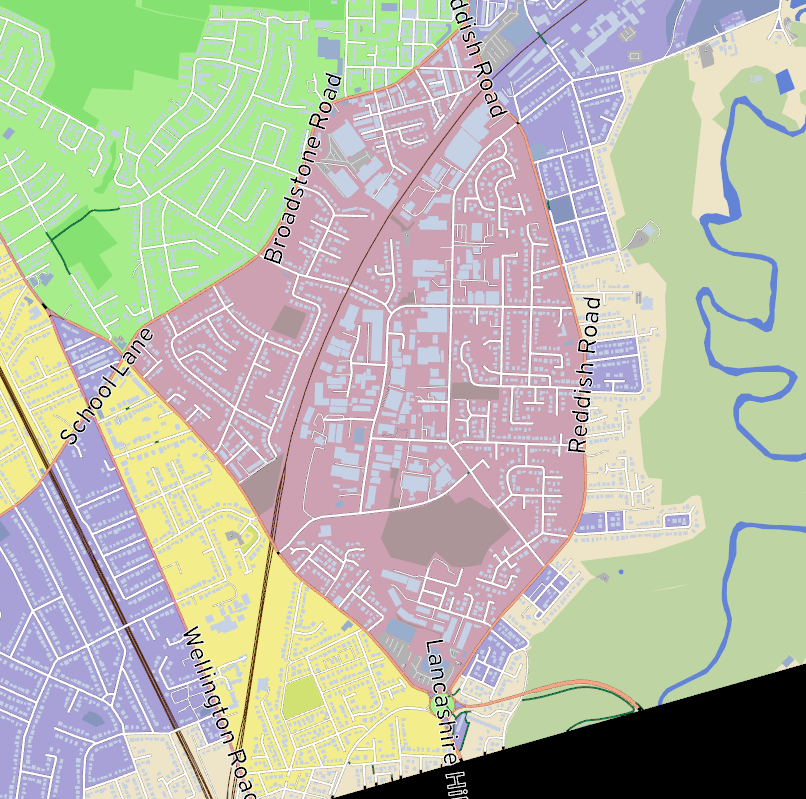
- the perimeter
- usually “major” roads designed to handle more traffic
- the interior
- reduce traffic through here
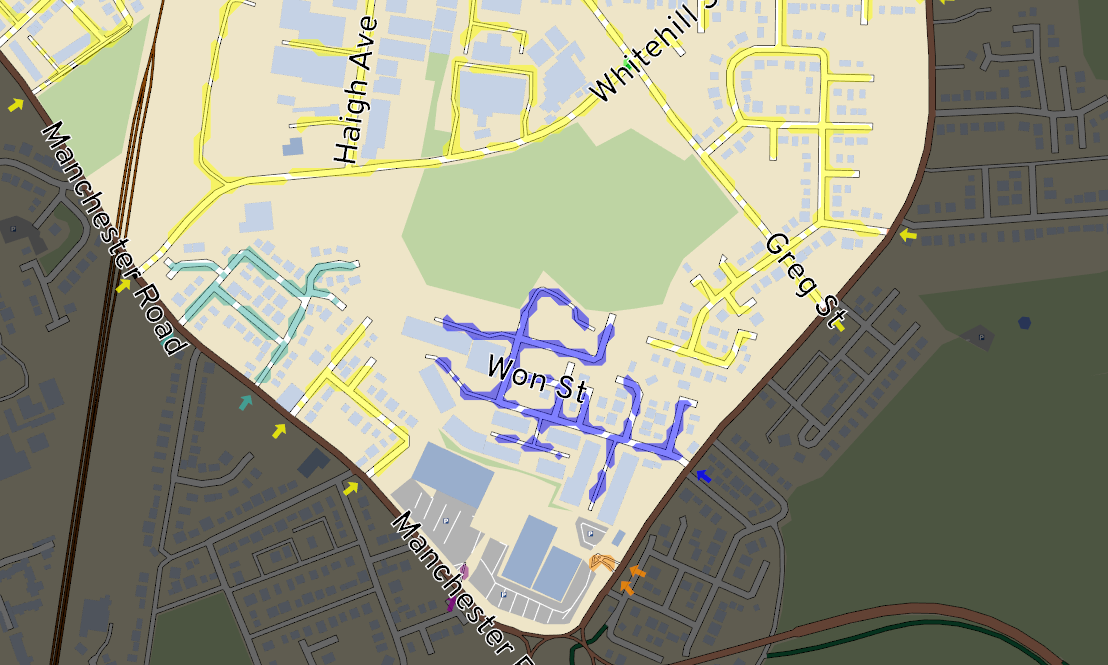
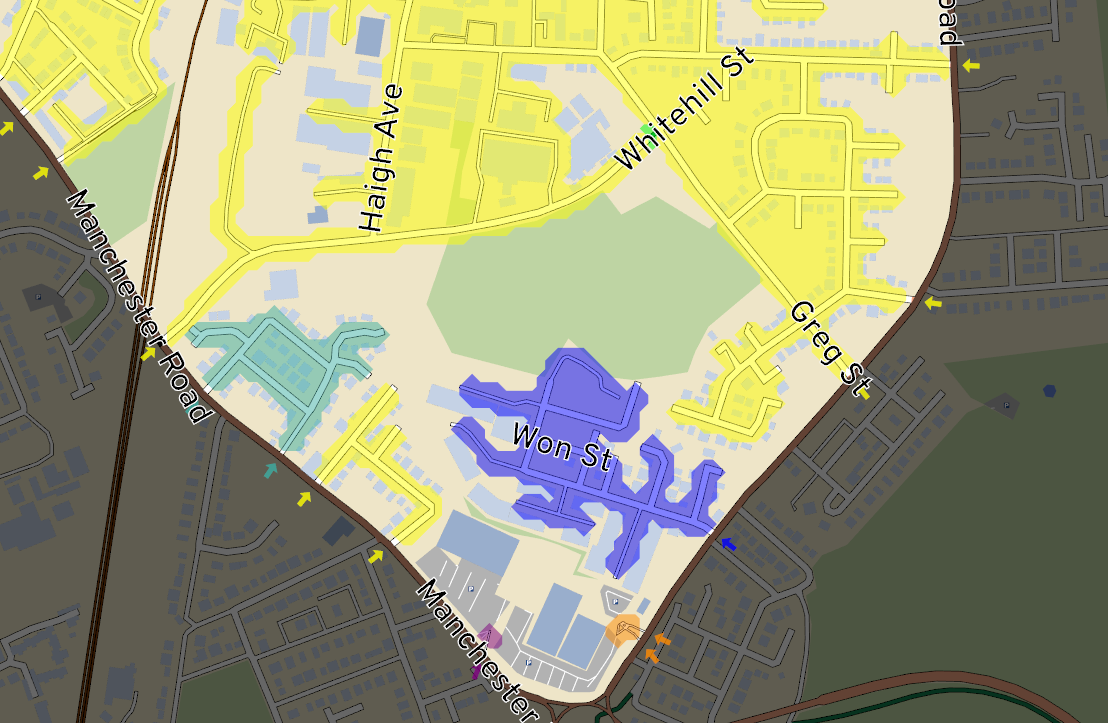
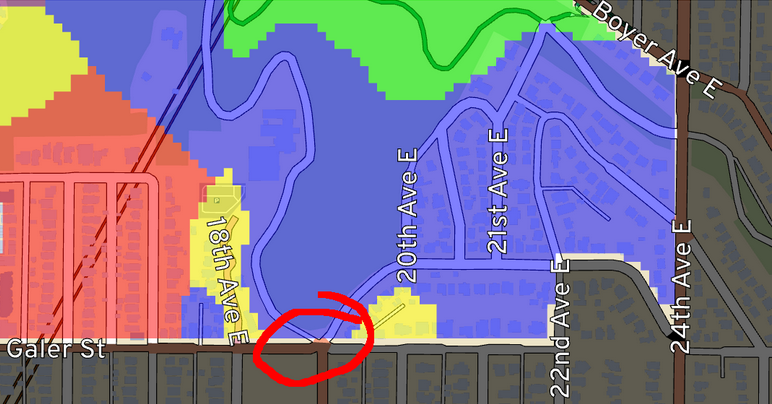
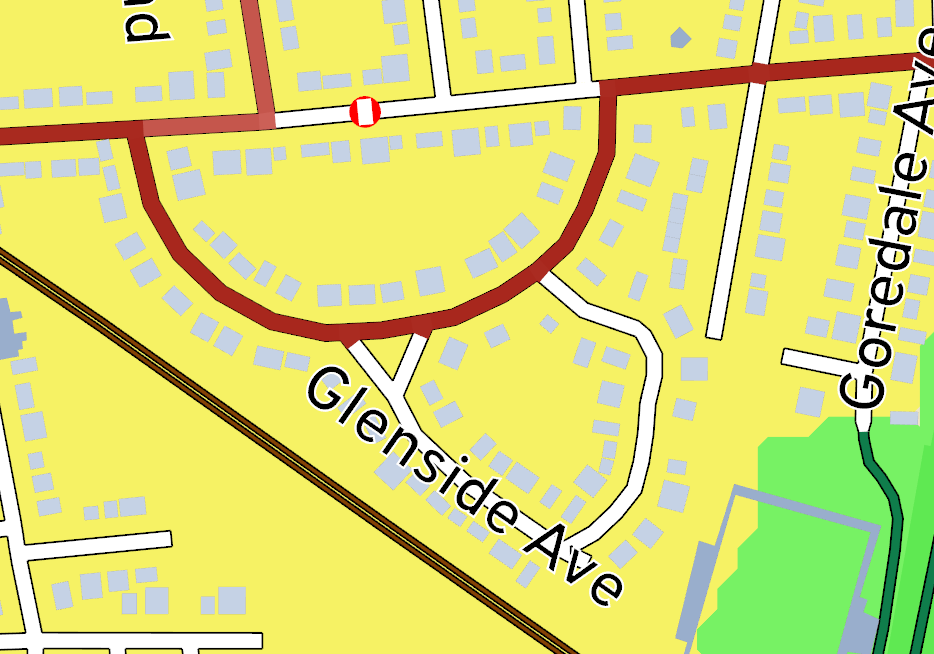
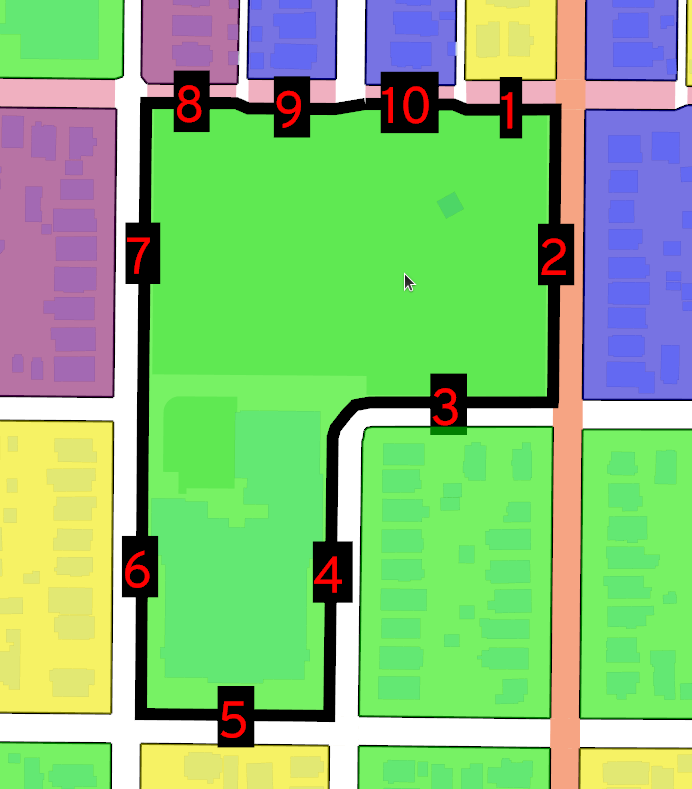
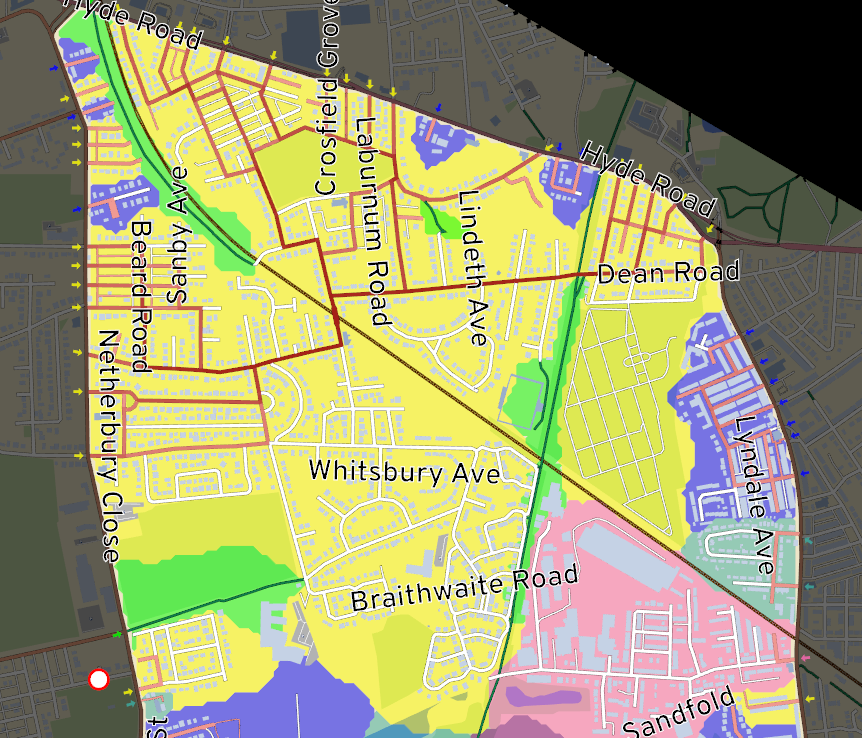
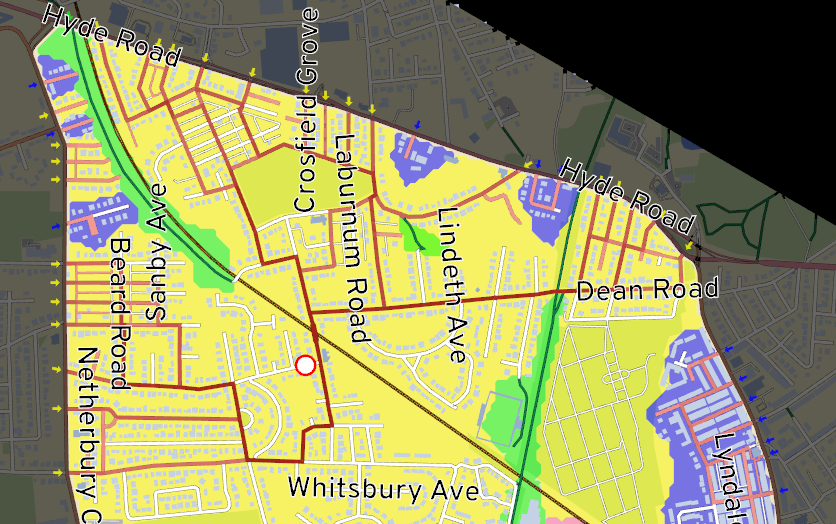
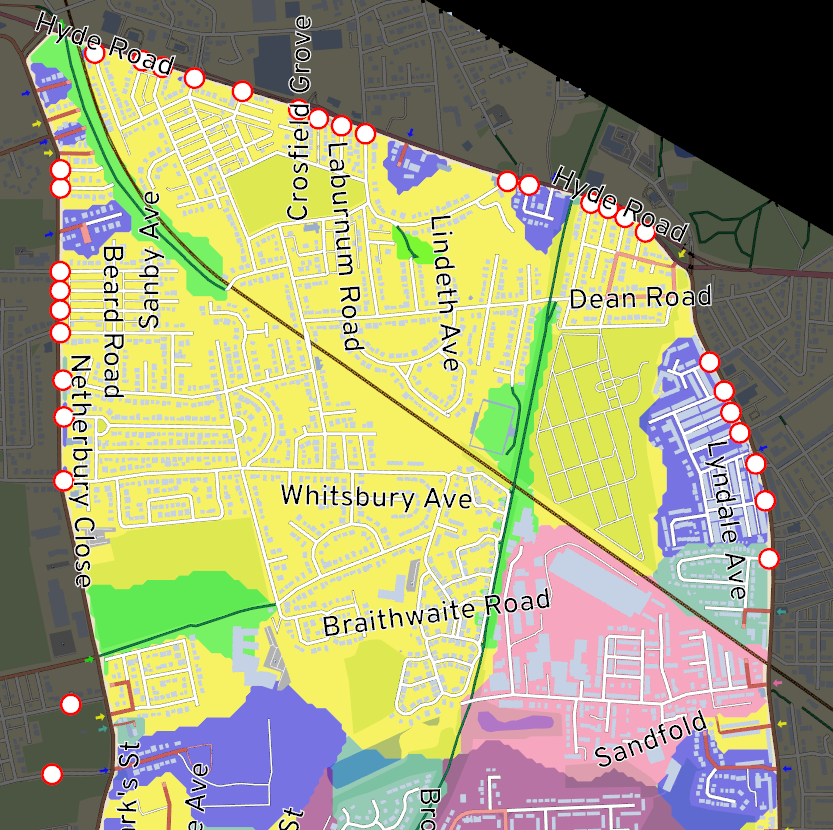
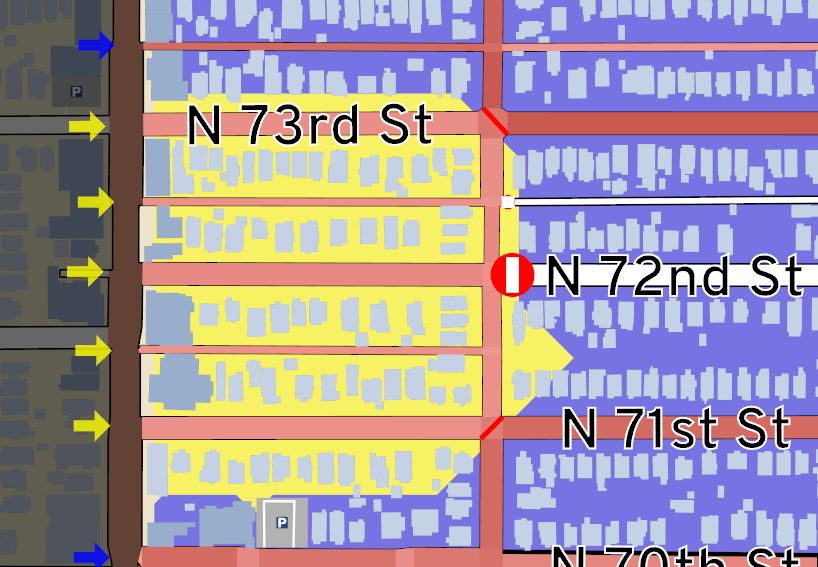
Cells
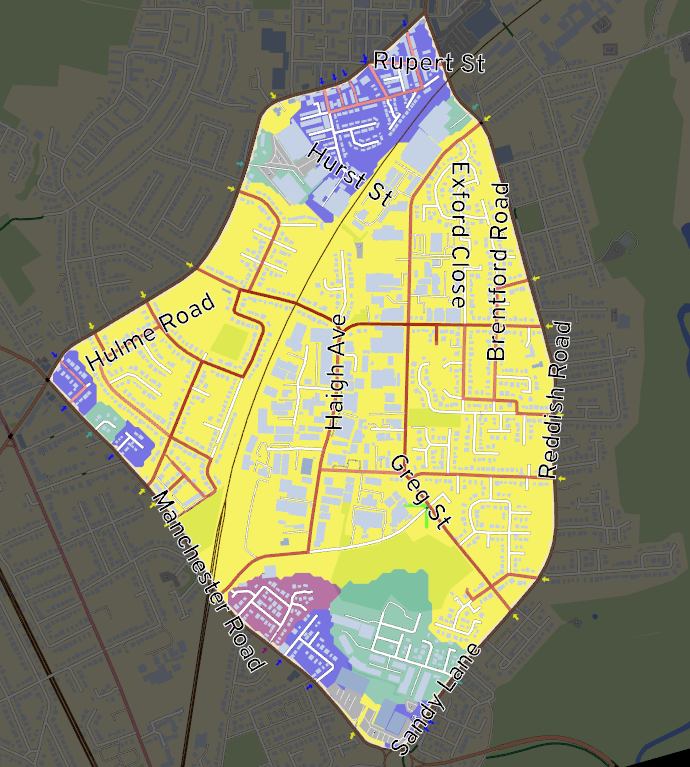
Everywhere reachable by driving within the neighborhood, without leaving
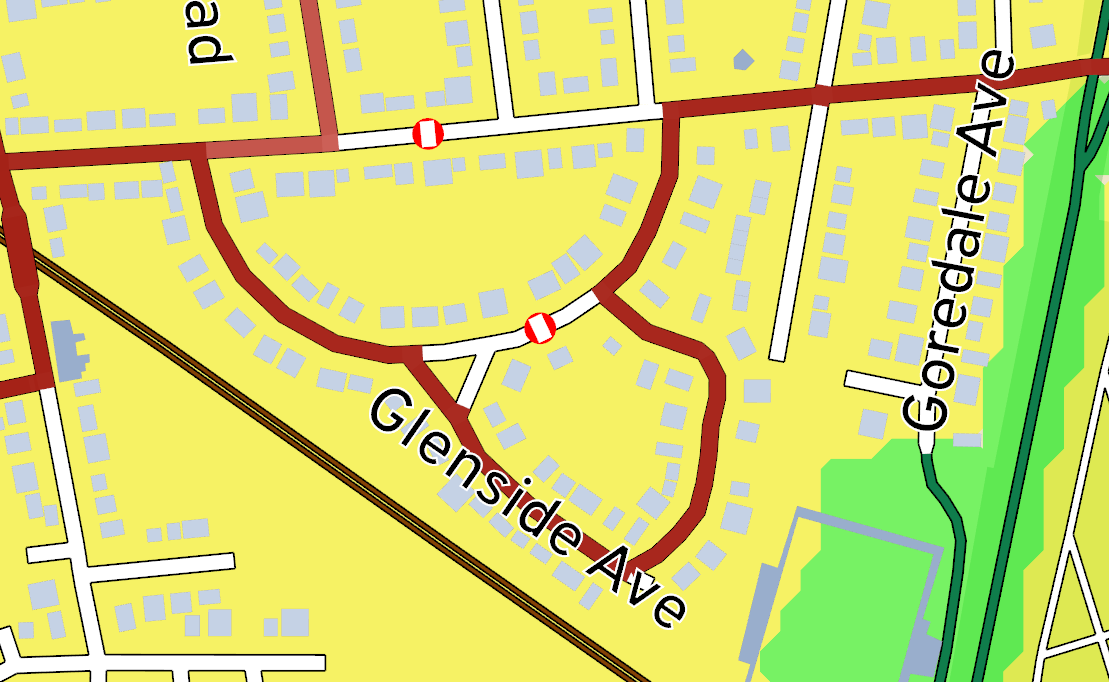
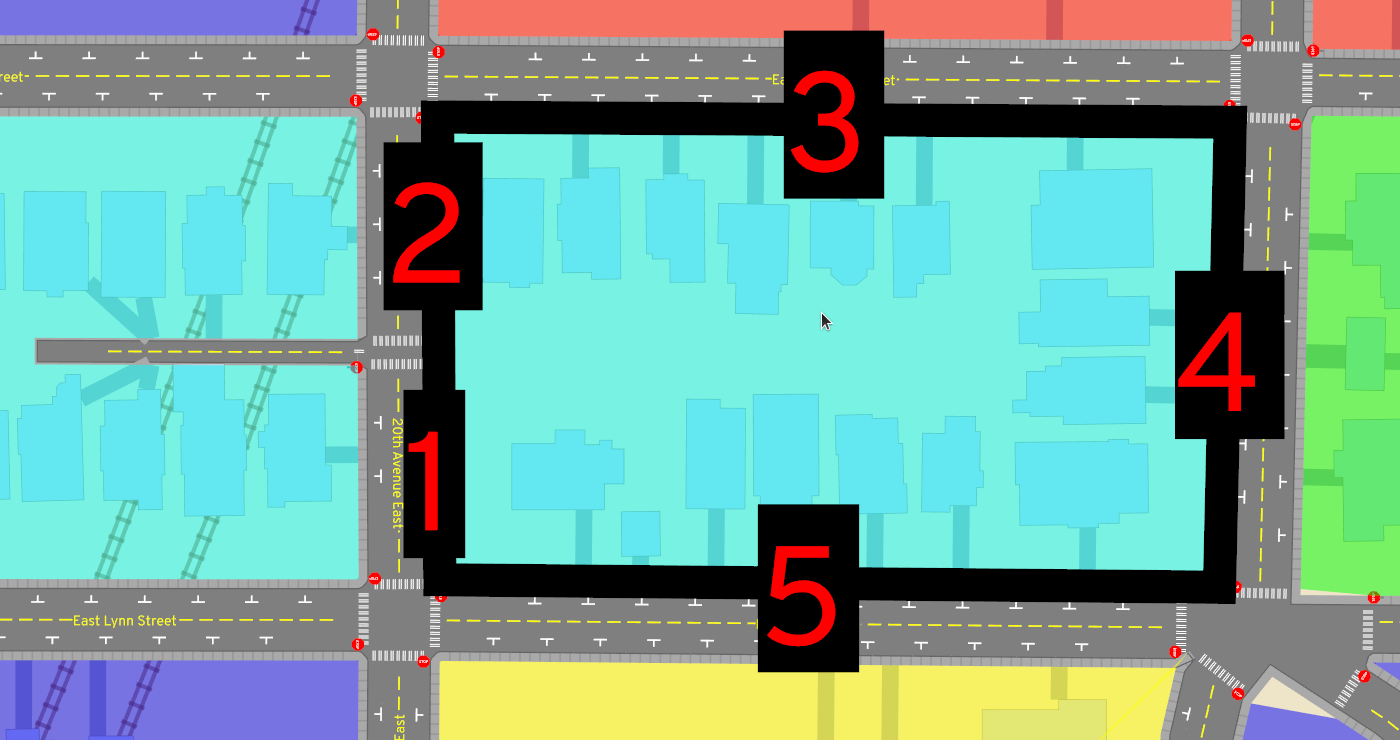
Cells
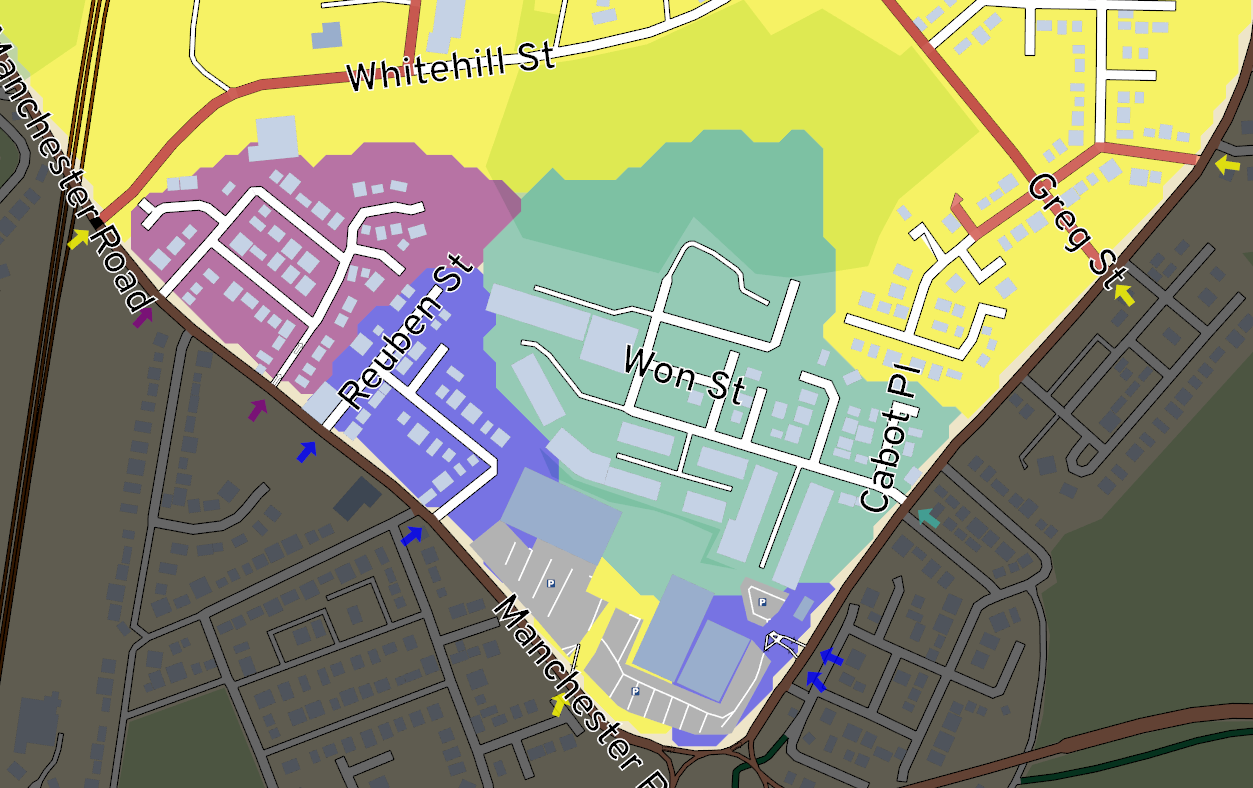
Disconnected cells
- A cell must touch the perimeter somewhere!
- Otherwise, drivers can’t get in / out
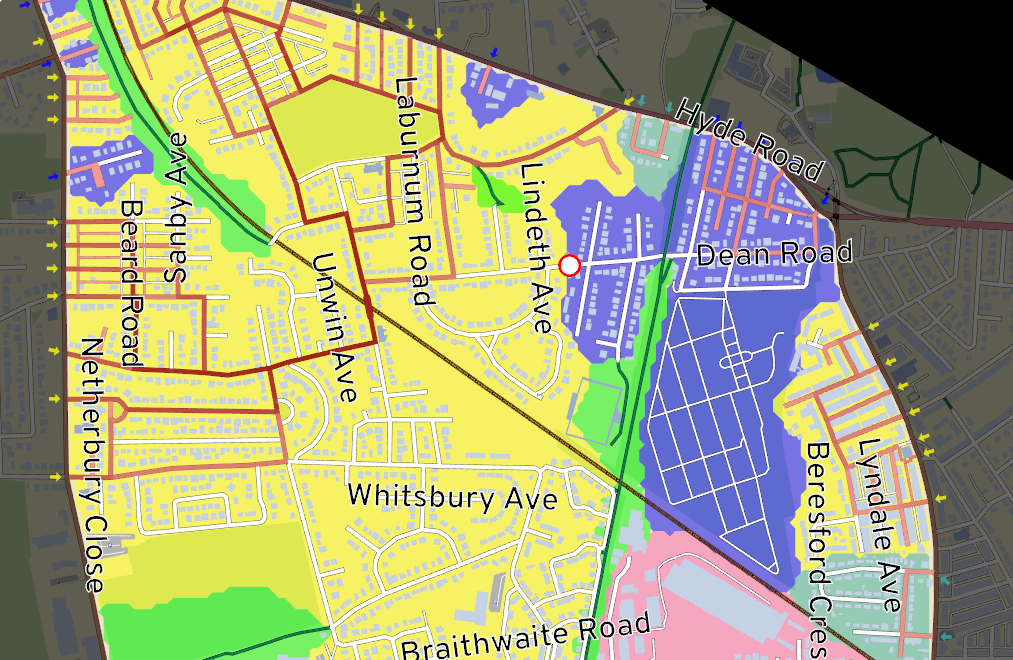
Floodfill
Floodfill

Floodfill
Floodfill
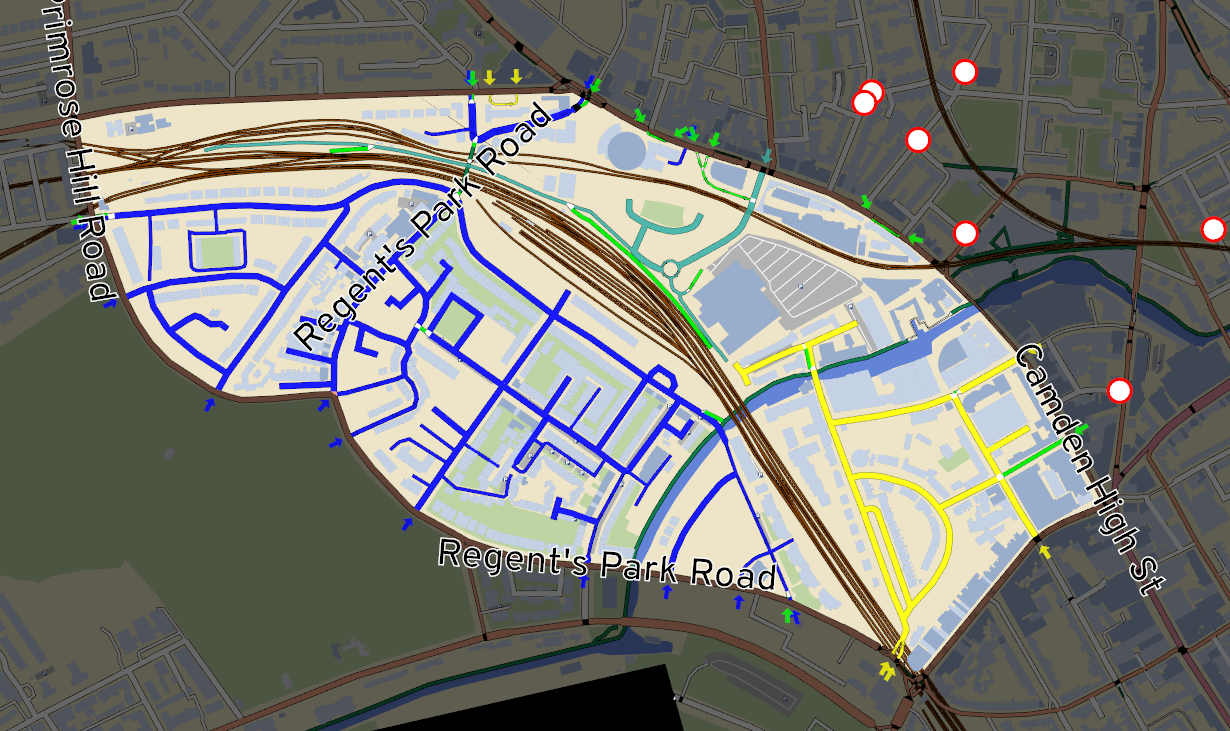
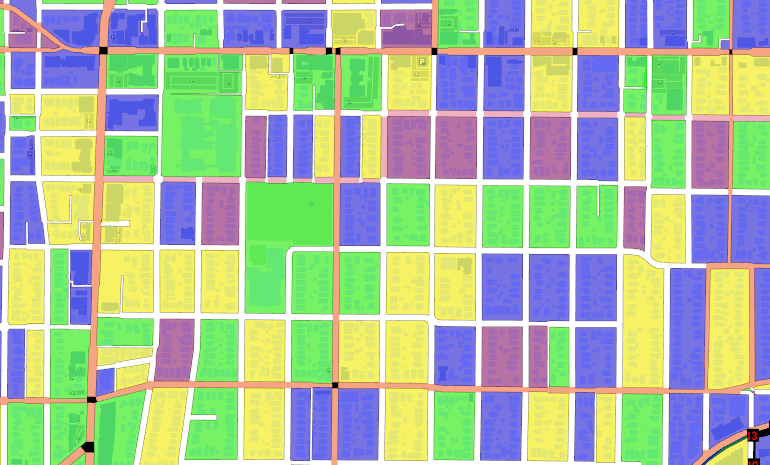
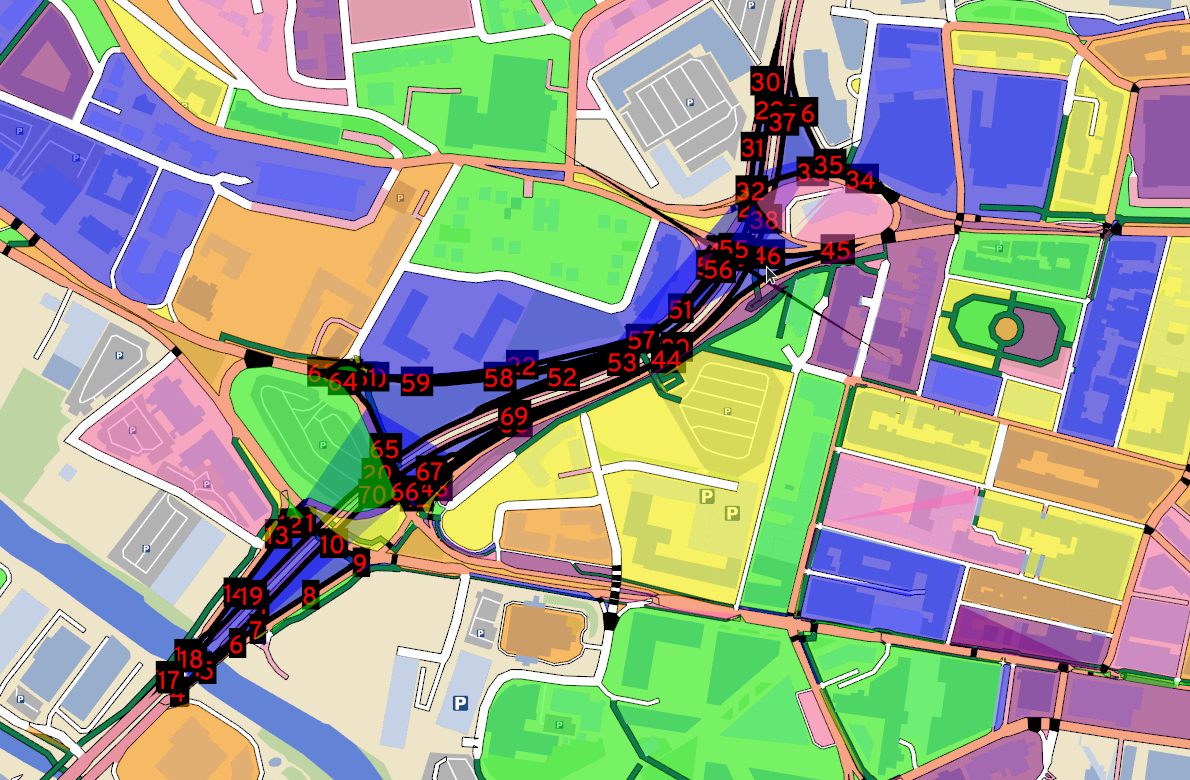
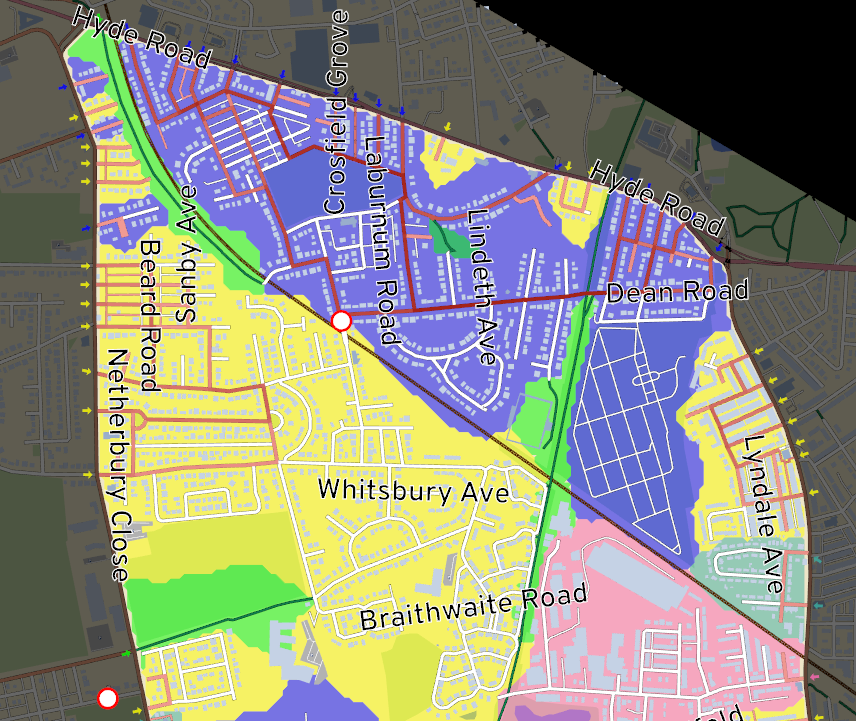
The result
The graph of the neighborhood partitioned into strongly-connected components
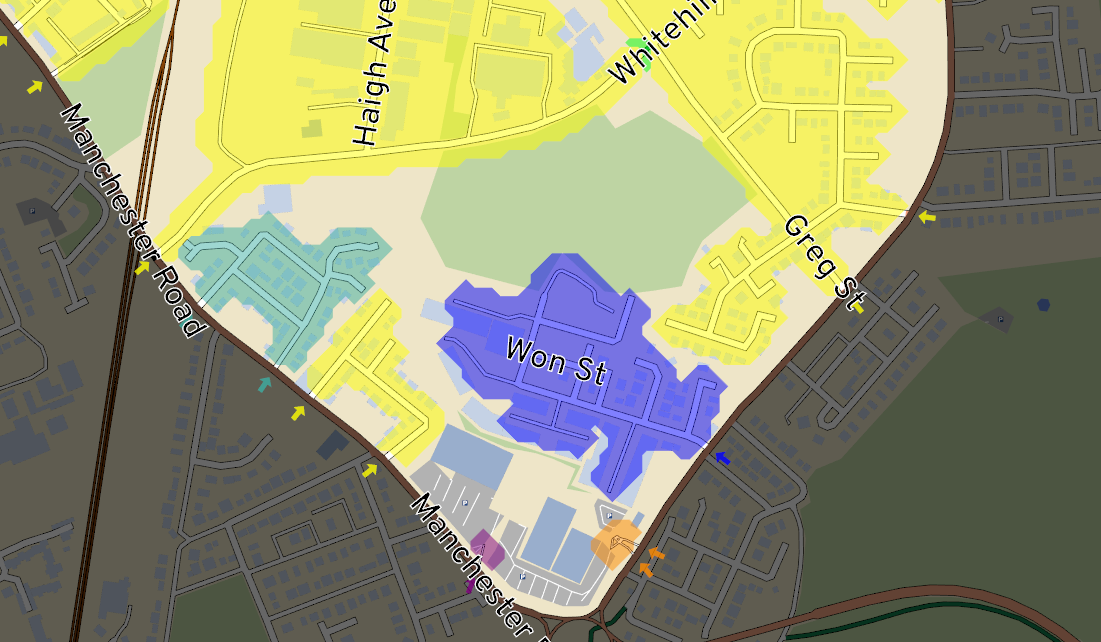
Cells as areas
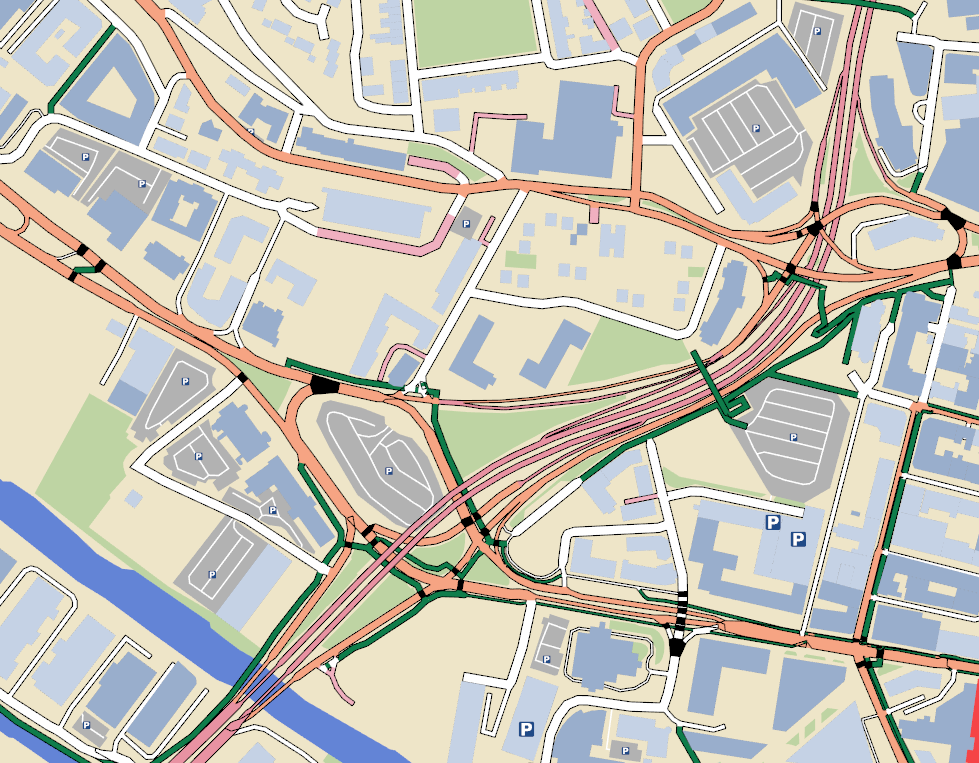
Can we match this?
Voronoi diagrams

(Balu Ertl on Wikipedia, CC BY-SA 4.0)
Not straightforward to apply to line segments
Approximating with grids
Approximating with grids
Approximating with grids
Approximating with grids

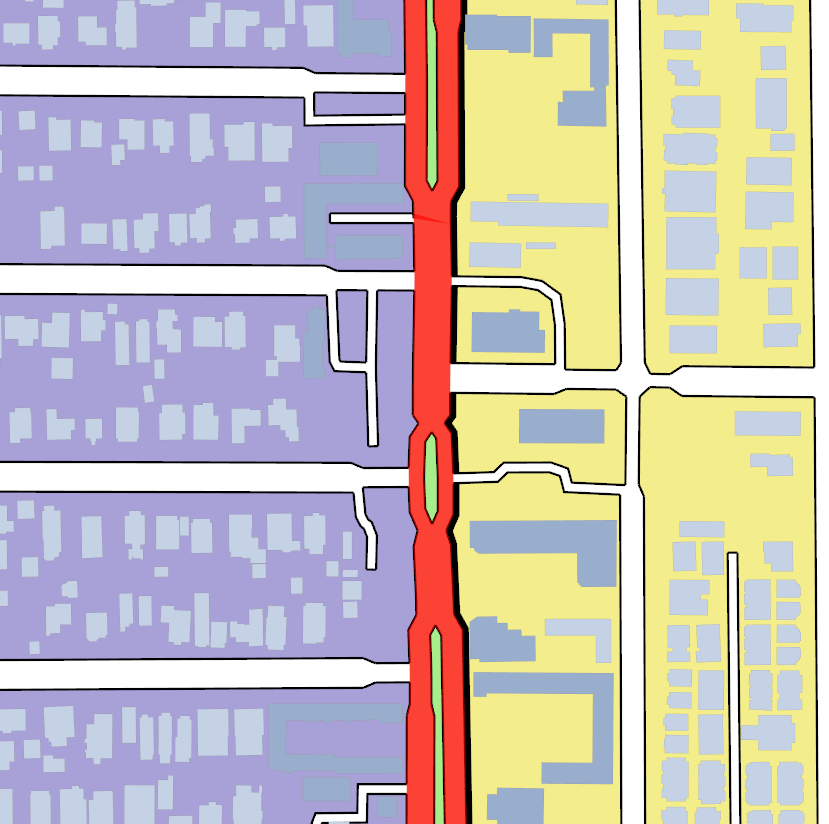
Marching Squares to turn the grid into nice contours
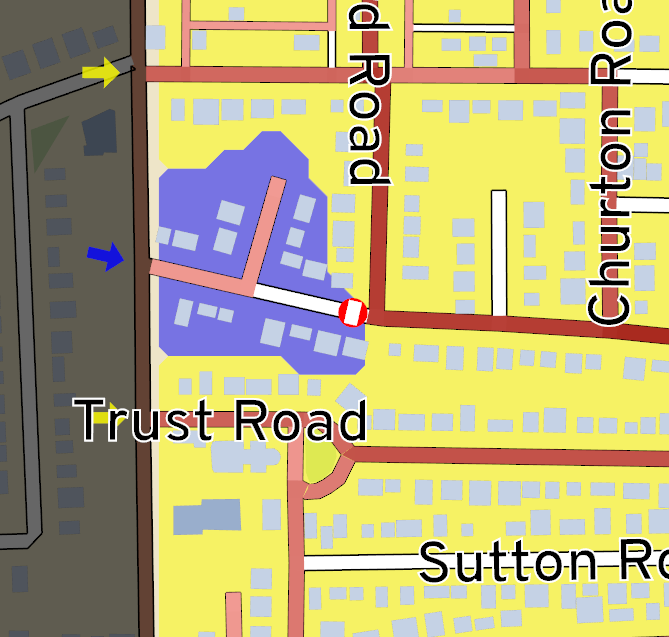
Edge cases with calculating cells
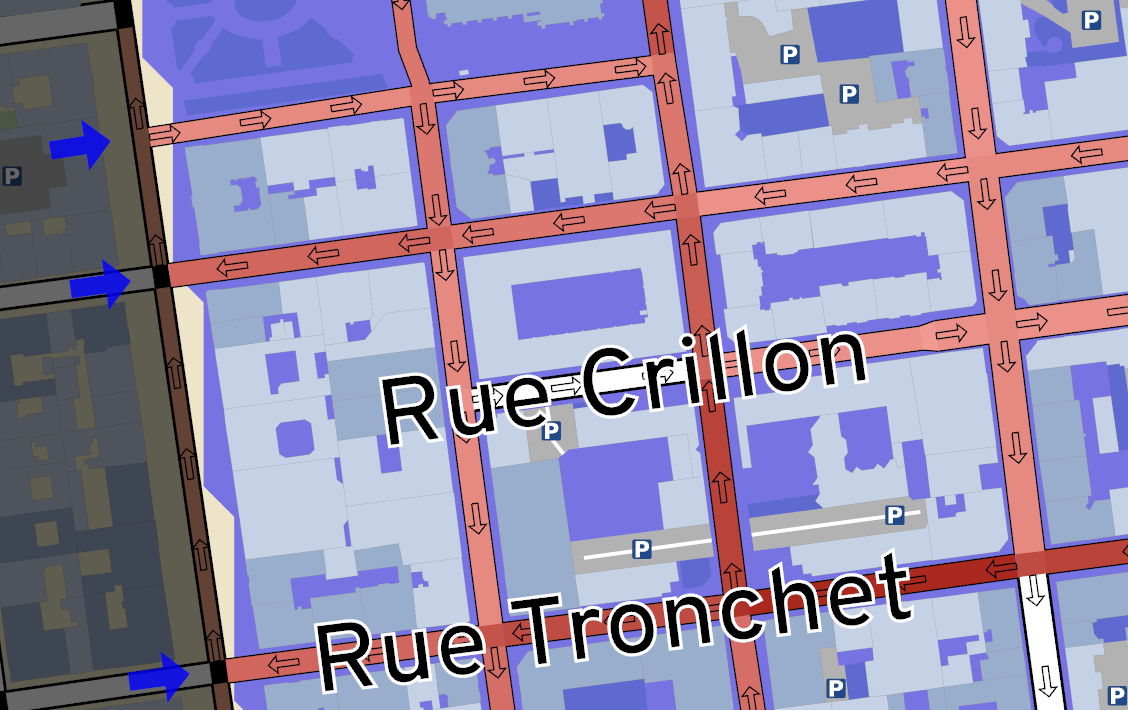
One-way streets
Edge cases with calculating cells
Roads without motor vehicles
Edge cases with calculating cells
Is this one cell?
Edge cases with calculating cells
Does this path leave the neighborhood?
Edge cases with calculating cells
Decision: separate cells
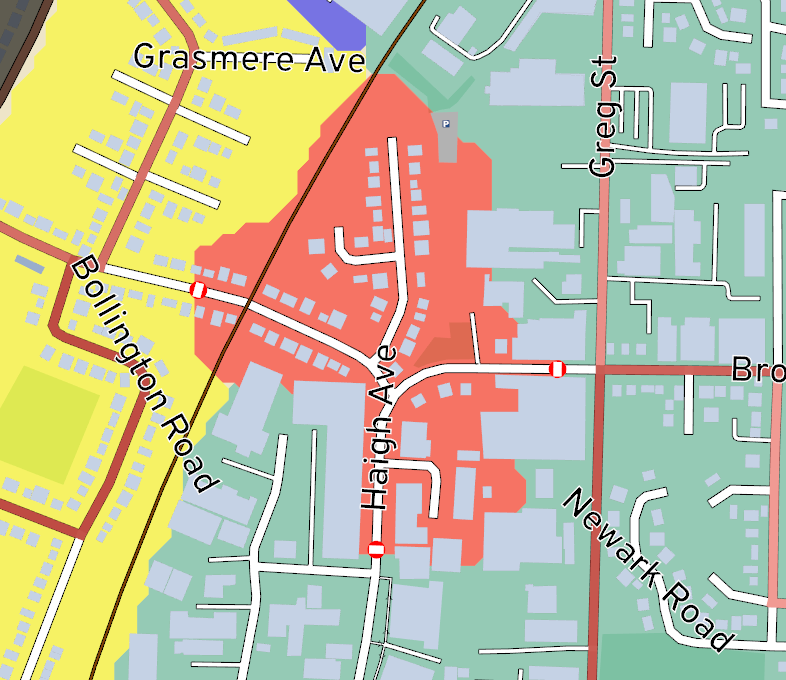
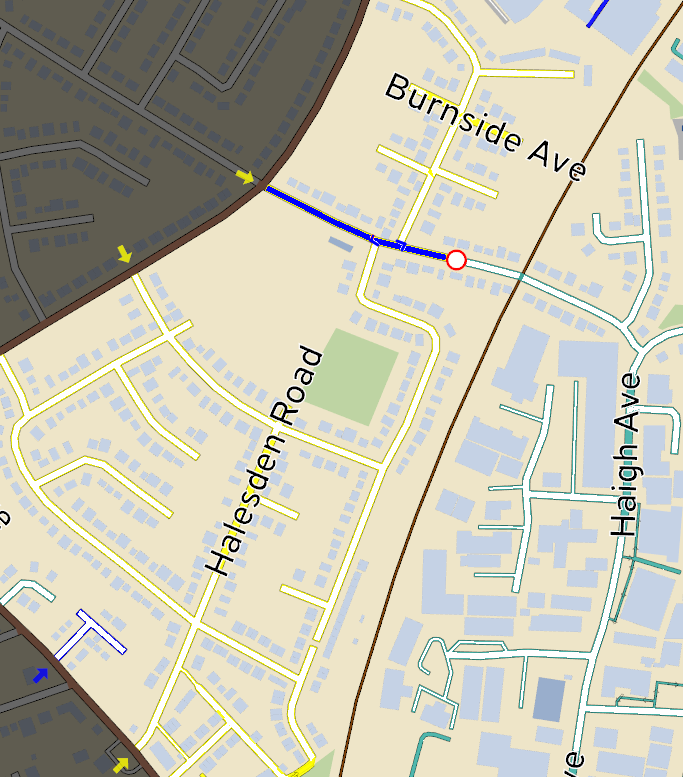
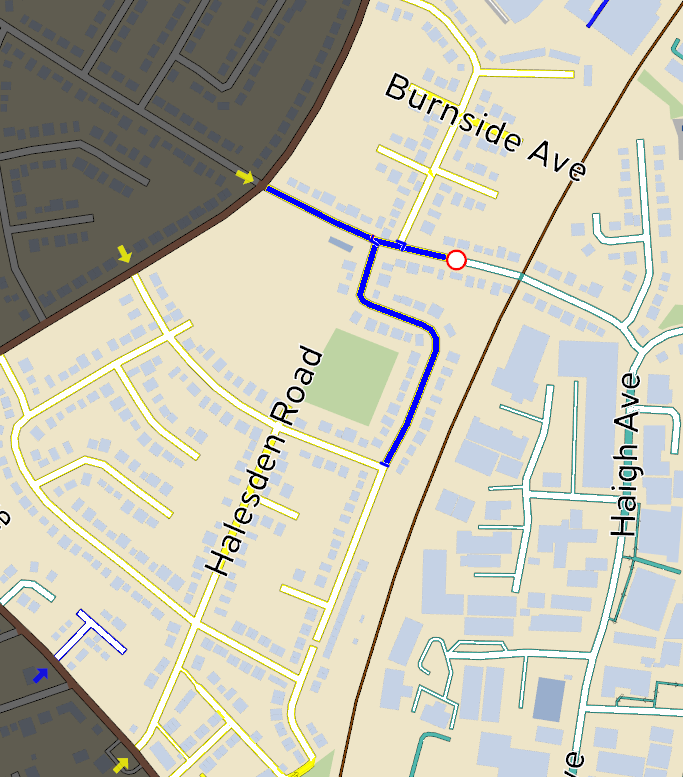
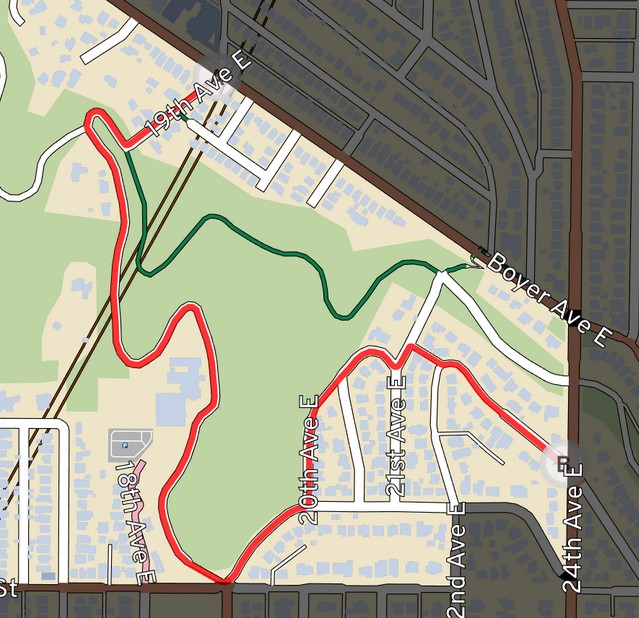
Predicting rat-runs
- What’s a rat-run?
- Why are some streets quiet?
Predicting rat-runs
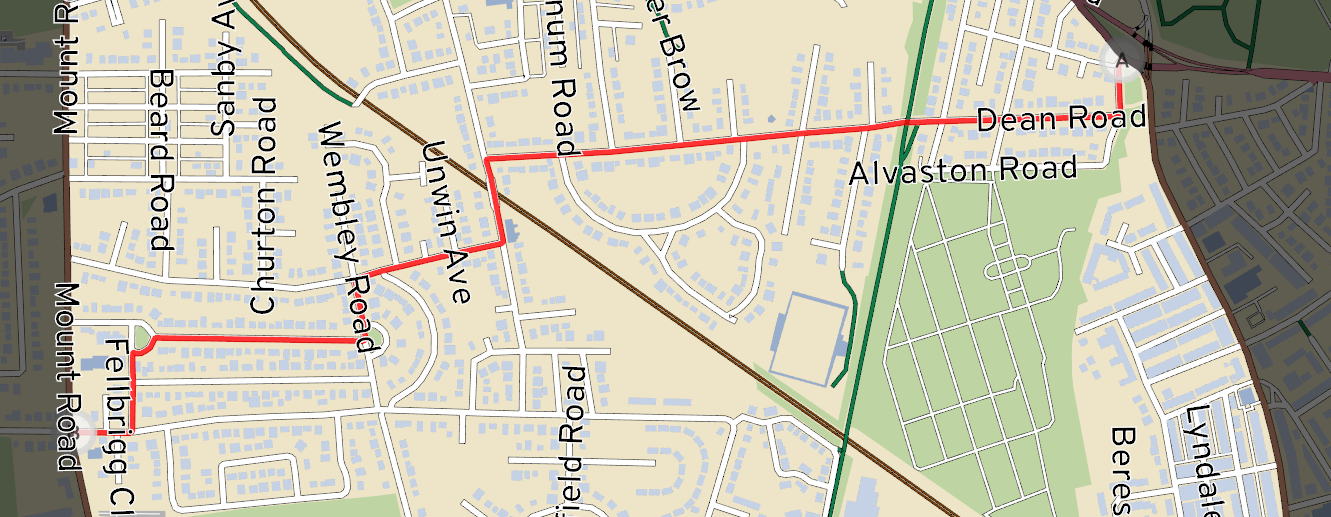
Rat-run definition
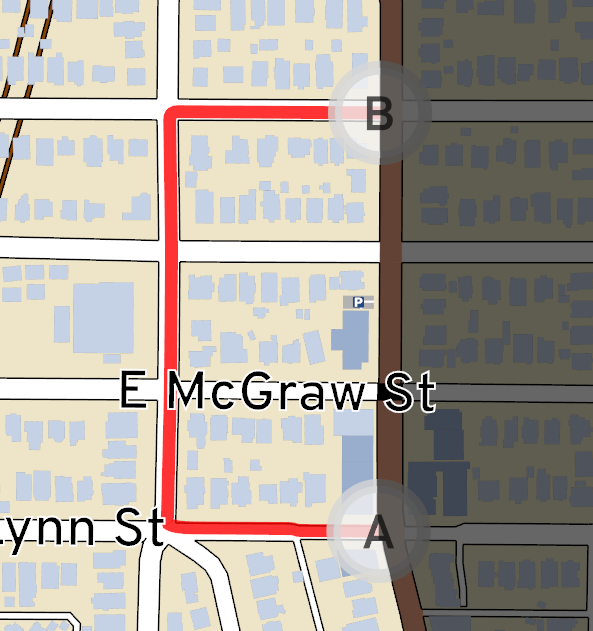
- The start and end must be on different roads
- Name changes
Rat-run definition
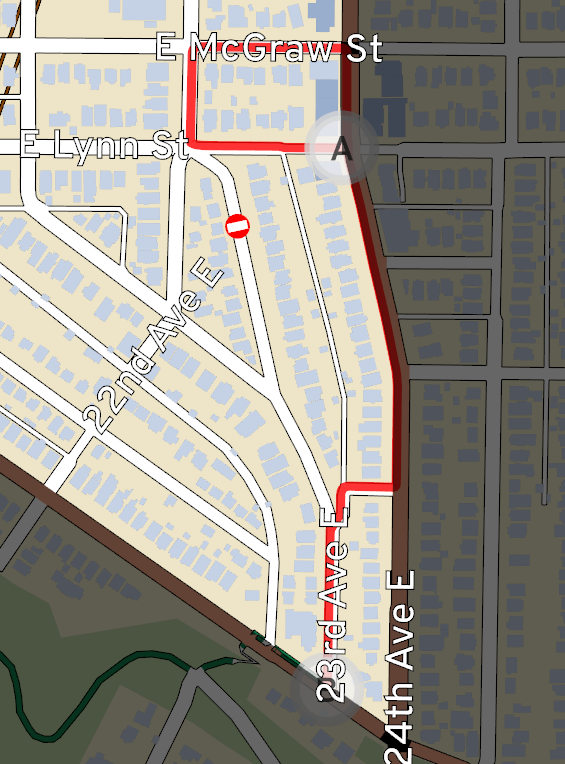
In freeflow conditions, the perimeter road is faster
Rat-run definition

Force the shortest path to stay inside the neighborhood
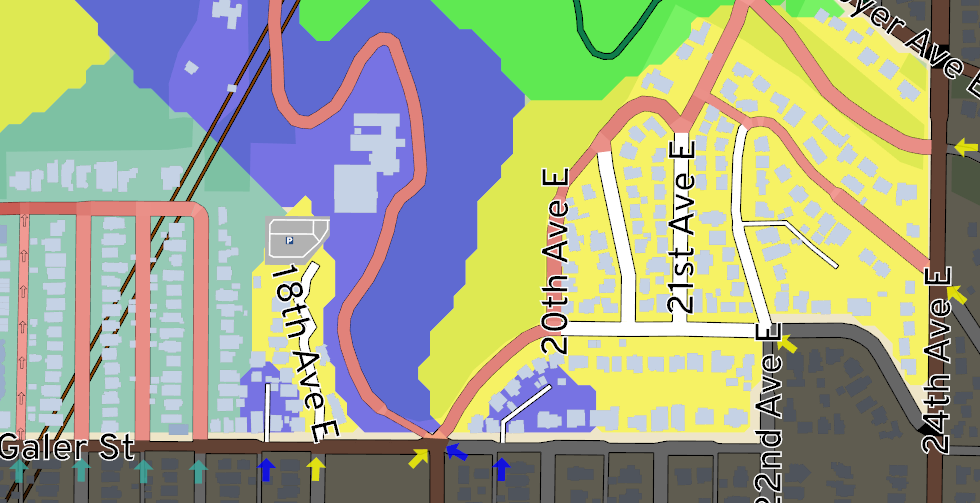
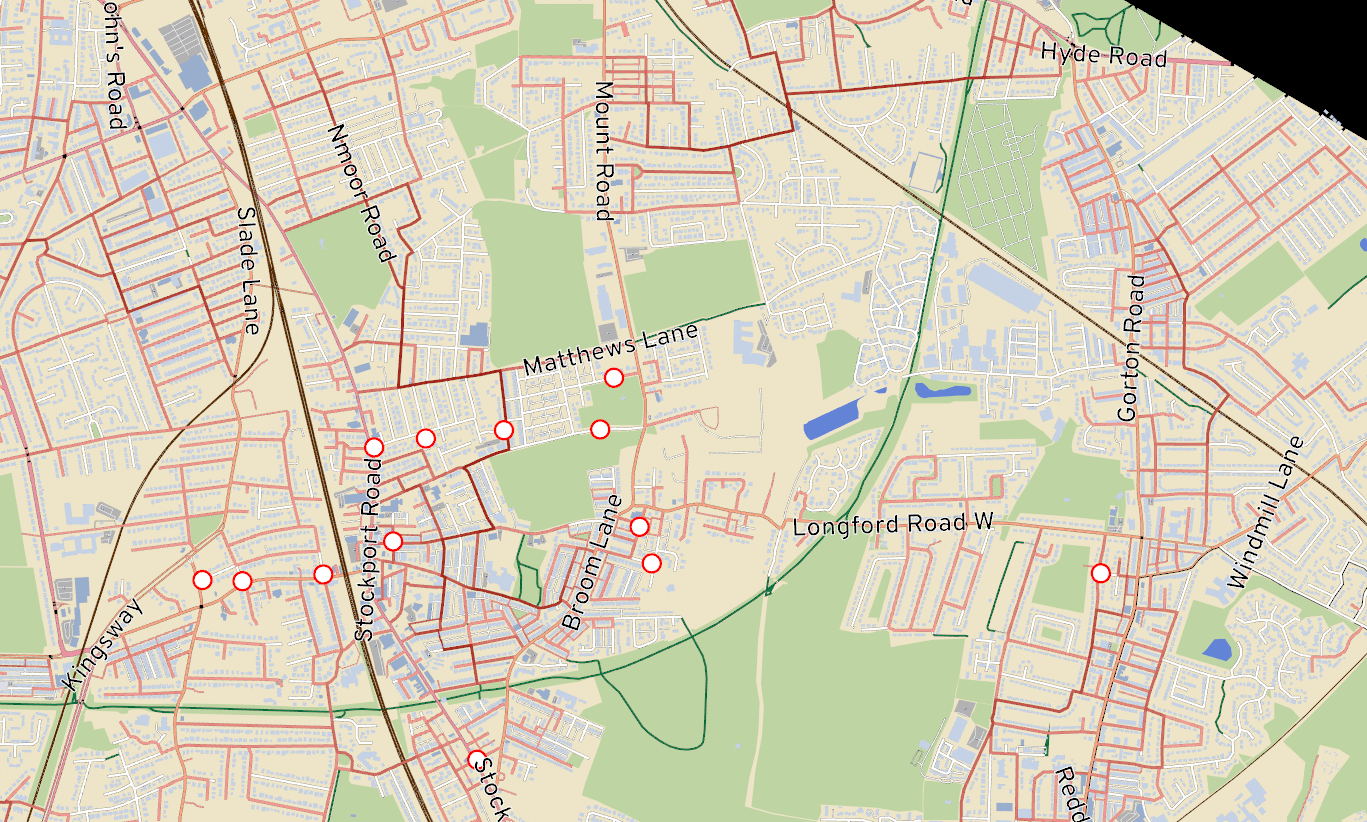
Rat-run results
Rat-run results
Rat-run results
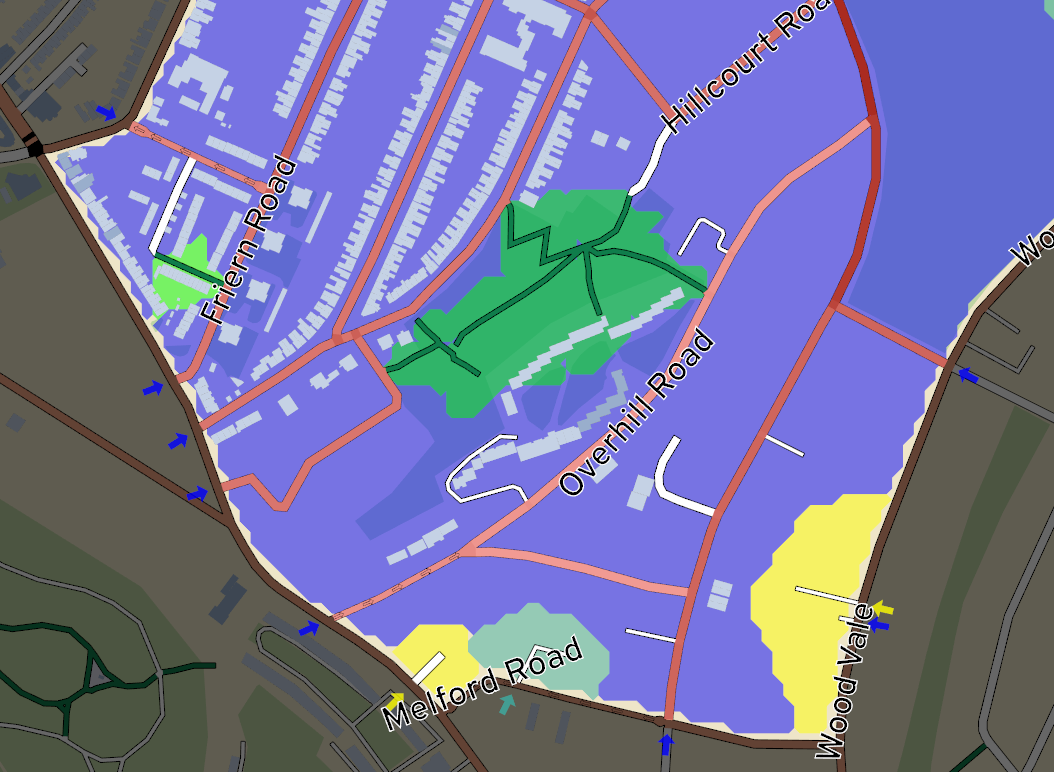
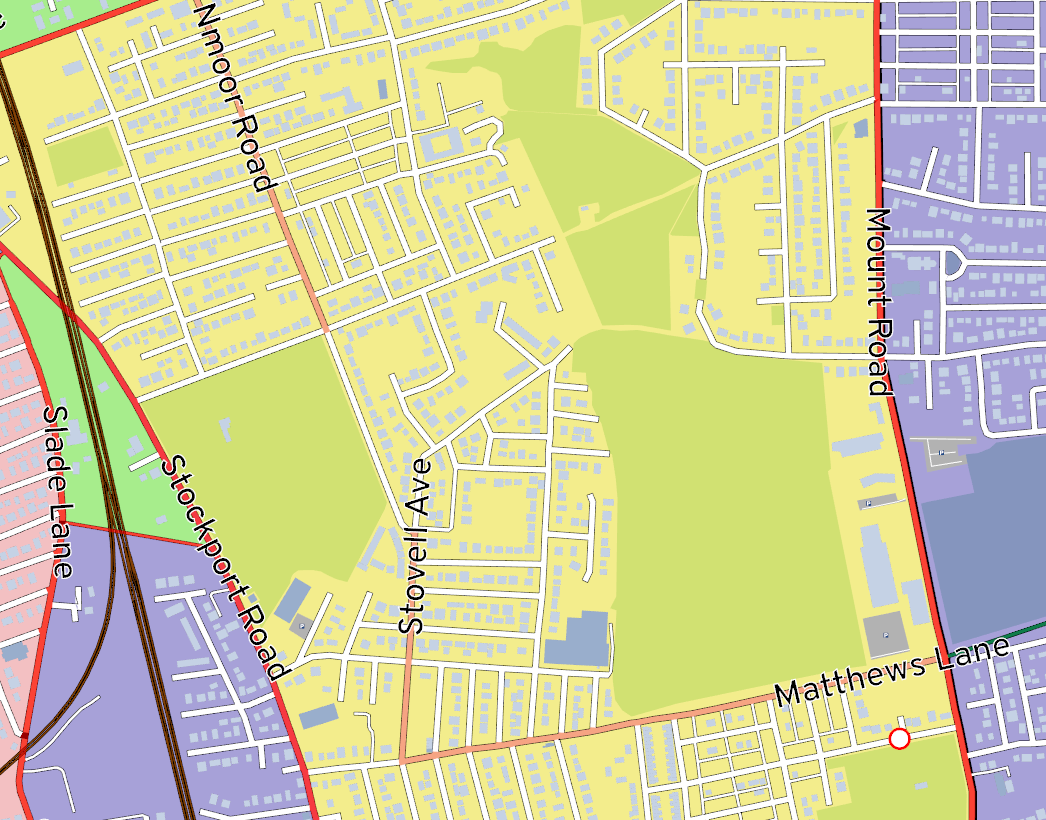
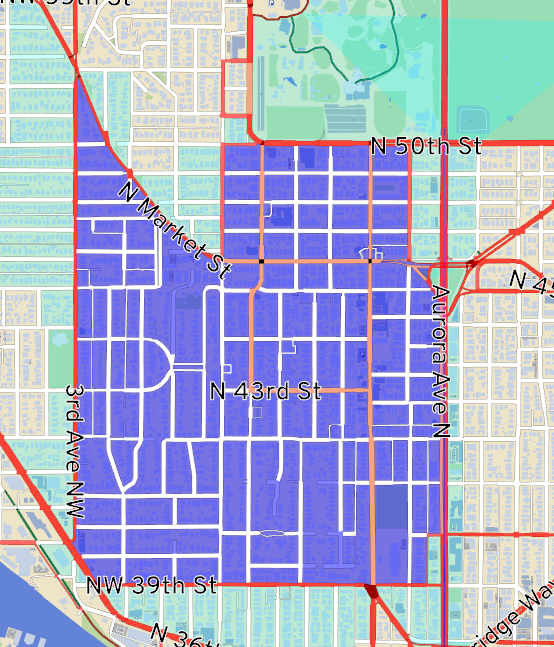
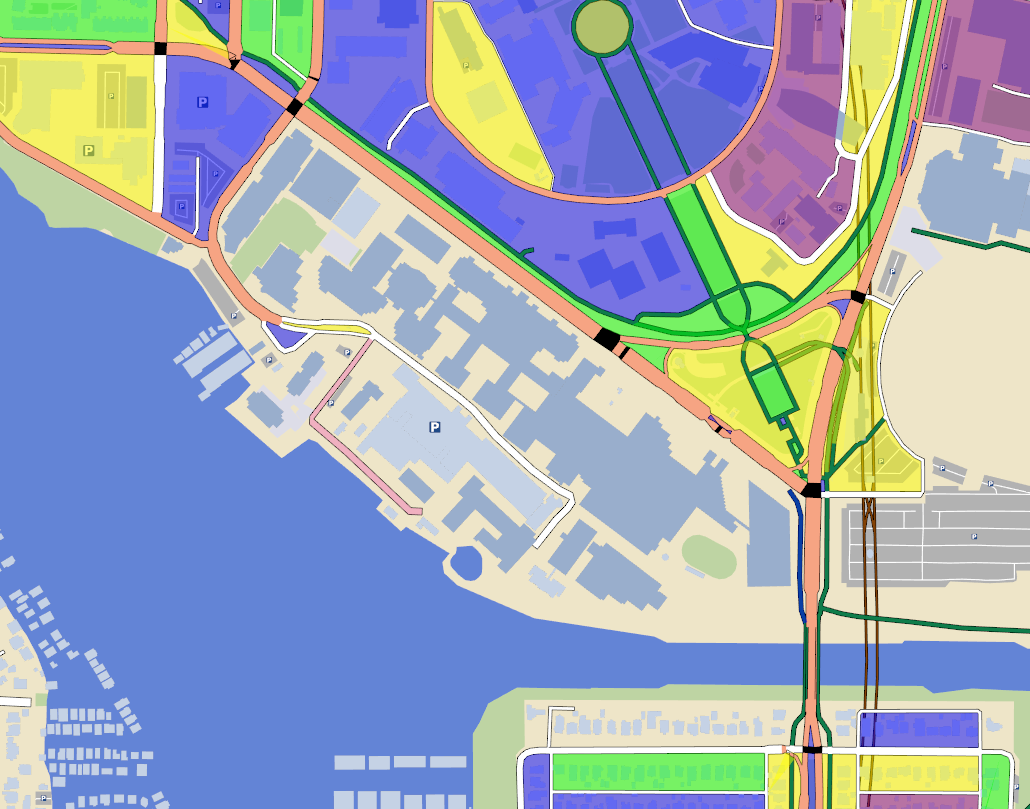
Defining a neighborhood

Defining a neighborhood
- This process will cross railroads, water
- If it didn’t, we’re fine with heavy traffic on the nearest local road
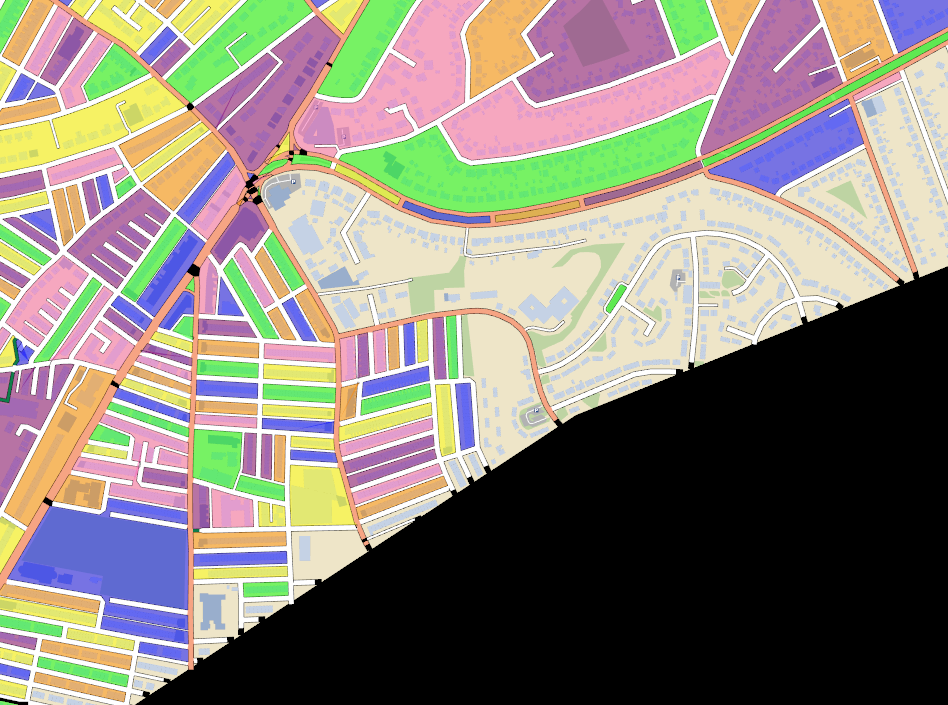
Defining a neighborhood
Sometimes major roads just end
Defining a neighborhood
Spaces in between motorway loops or dual carriageways
Boundary adjustment
Don’t be too prescriptive; let users adjust
Boundary adjustment
Boundary adjustment
- Per block
- Partitioning into contiguous neighborhoods
- Adding a block to one neighborhood removes it from another
Blockfinding
- Trace around the edge of a road
- Uses the shape of roads and intersections, inferred from OpenStreetMap
- A block internally tracks a list of (road, left/right)
Merging two blocks

- Find the common slice of the perimeters
- “Rotate” the perimeter until the common part matches up
- Slice and stitch together
Merging two blocks

Merging two blocks
- Collapsing dead-ends
- Clockwise and counter-clockwise blocks
- Winding order
Blockfinding limitations
Only traces roads, not natural features
Blockfinding limitations
Edge of the study area
Blockfinding limitations
- Bridges / tunnels
- Trace the 2D area of the planar graph?
- Skip them?
Blockfinding limitations
Blockfinding limitations
You can’t always draw the boundaries you want
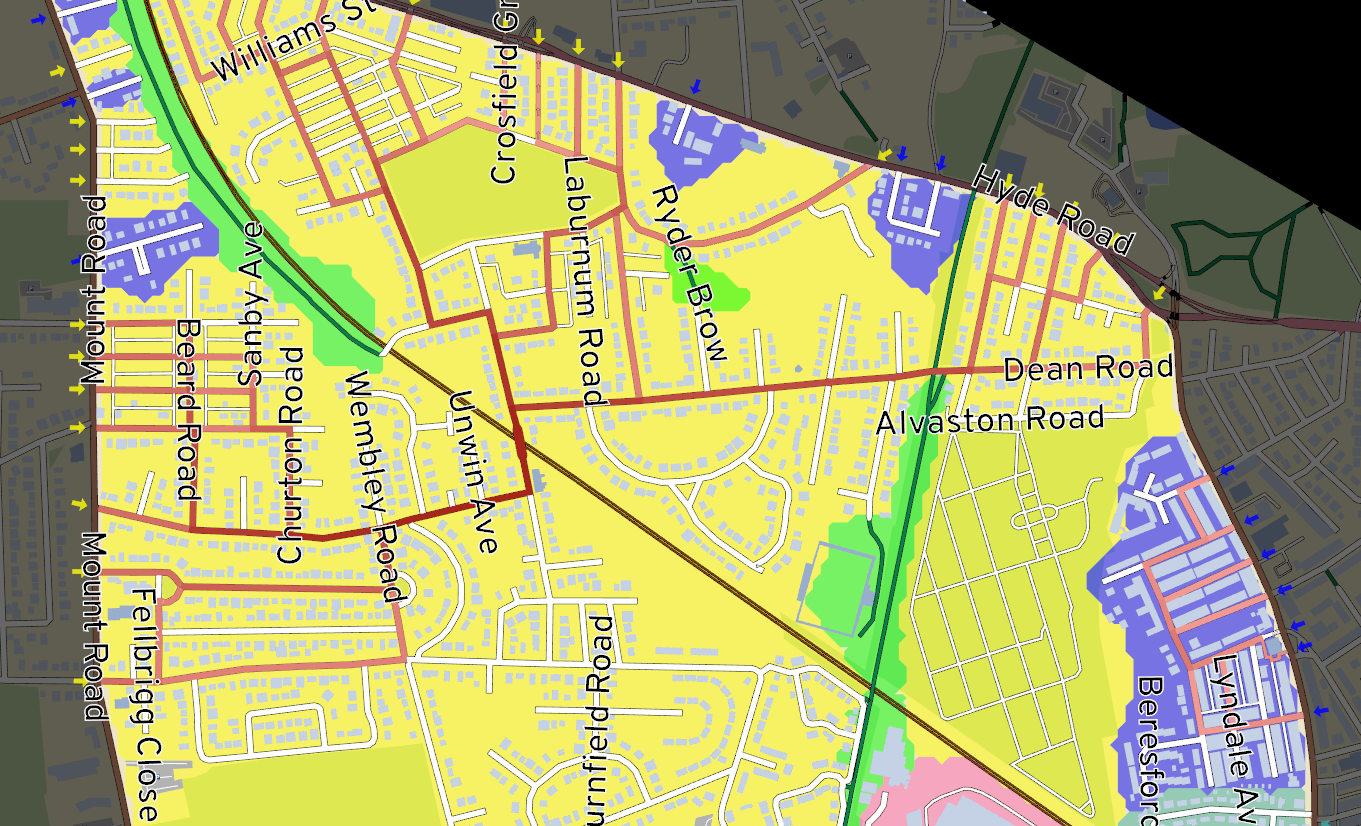
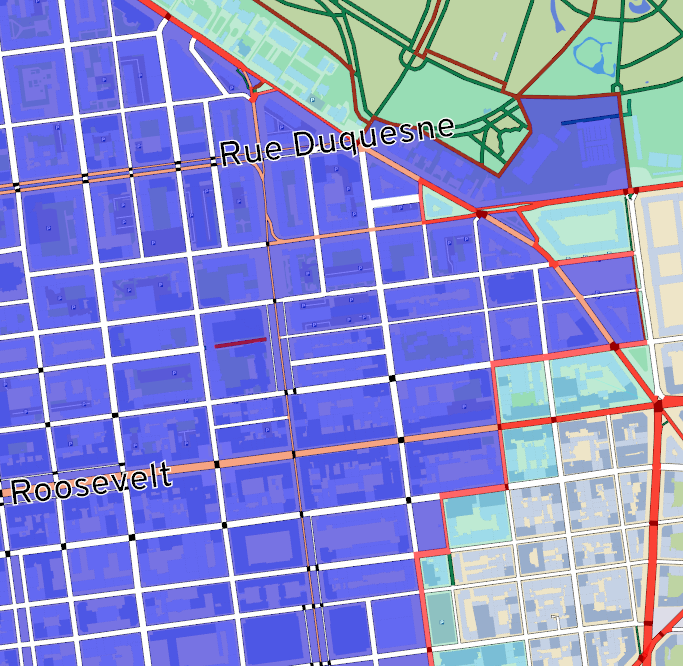
Assessing overall impact
- Show all rat-runs at once
- Rank neighborhoods by number of internal rat-runs
Assessing overall impact
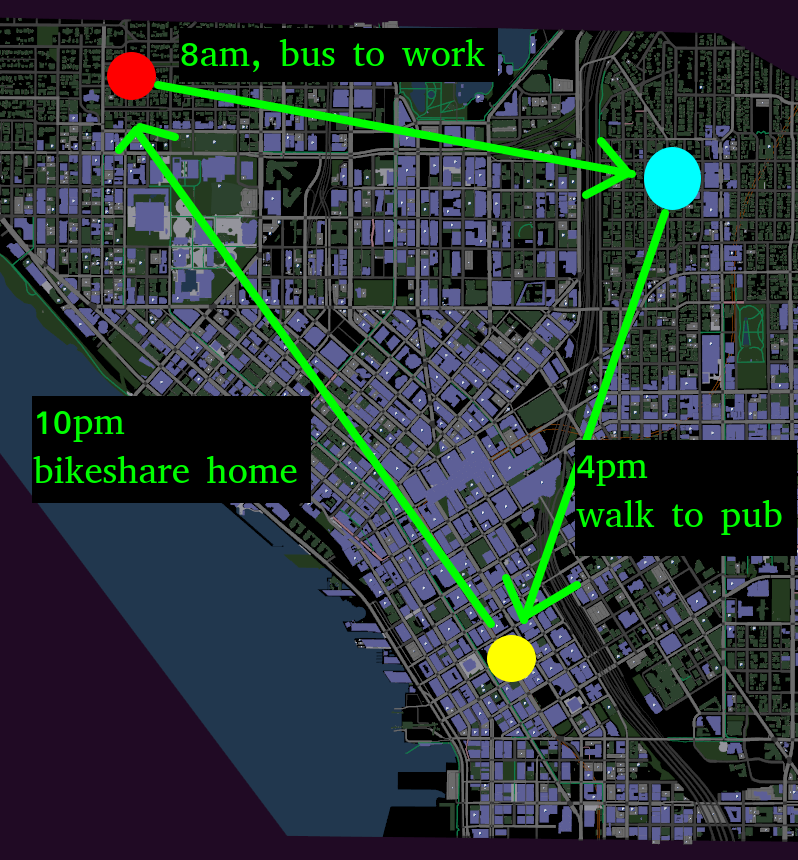
- Where do driving trips begin and end?
- For neighborhood-scale detours, MSOA zones are too large
Assessing overall impact
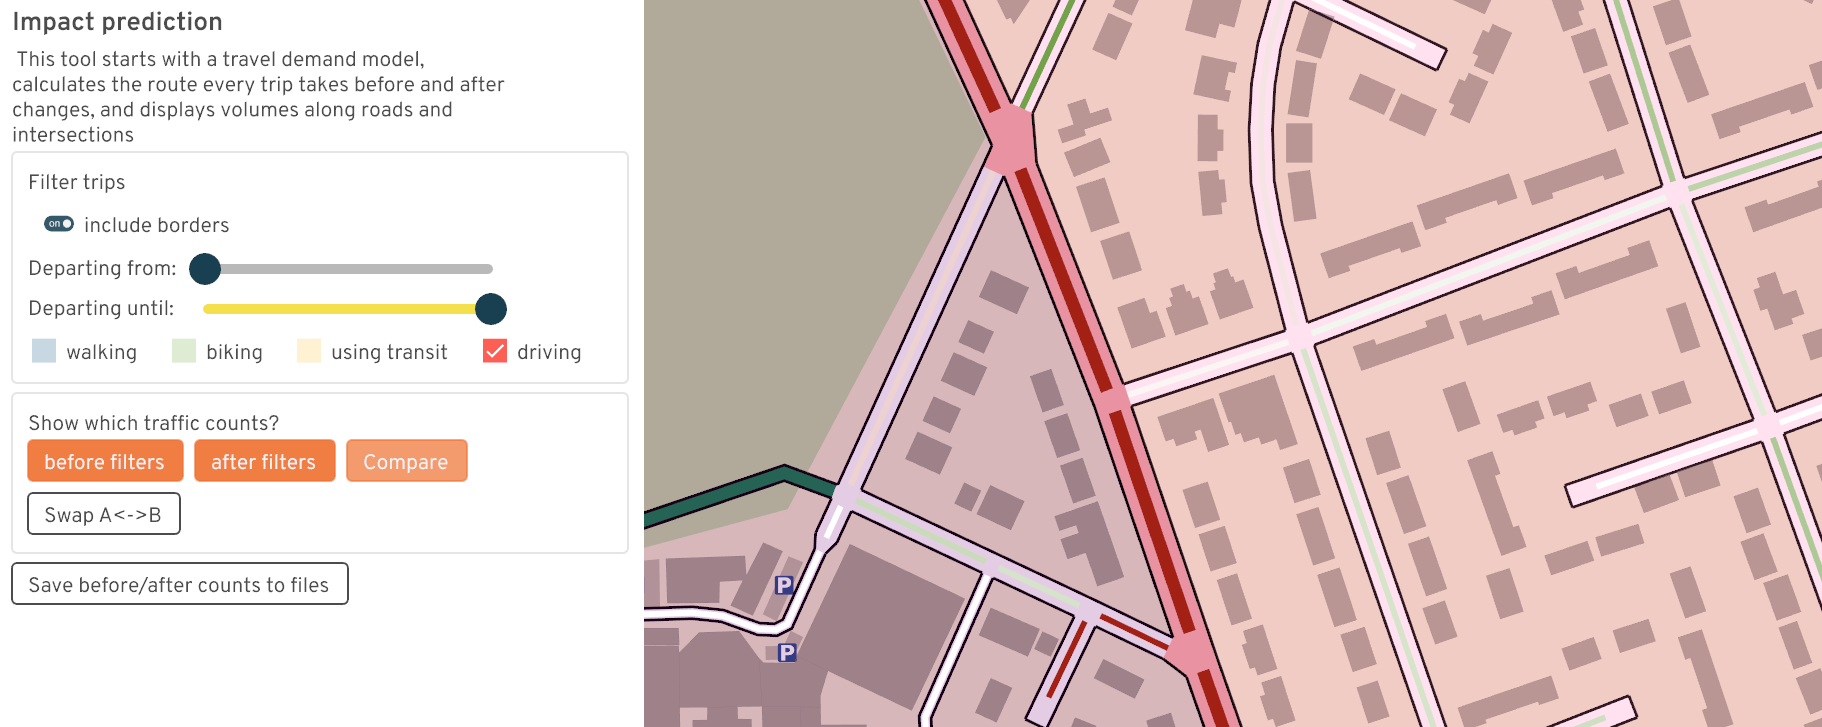
- Calculate all driving routes before and after filters
- Look for quieter and busier streets
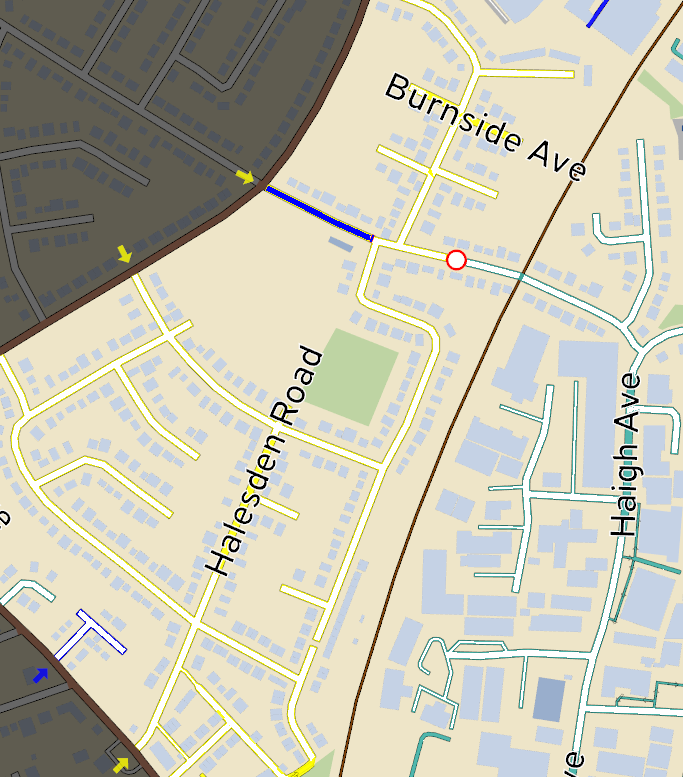
Where should the filter go?
Where should the filter go?
- Greedy: the road with the most rat-runs
- Whack-a-mole
Where should the filter go?
- Only one entrance per cell
- Expensive, likely unpopular
- Very different results for residents
- Simpler crossings along the perimeter
Heuristics for placing filters
Split large cells (intuition)
Heuristics for placing filters
Minimum cut of the graph
Heuristics for placing filters
- Trivial solutions near the perimeter
- How large are the two resulting cells?
Heuristics for placing filters
Gridded streets?
Heuristics for placing filters
LTNs are just the start
- other parts of A/B Street can help
- road space reallocation
- 15-minute neighborhoods / land use patterns
- traffic simulation (rapid prototyping)
Conclusion
- http://ltn.abstreet.org
- dcarlino@turing.ac.uk
- Contact me to import a city, schedule training, discuss ideas